

 (Orig 2016 Updated 2026) One of the first things we normally look at when examining a mineral resource estimate is how much of the resource is classified as Measured and Indicated (“M+I”) and then compare that to the Inferred tonnage. It seems to be important to understand the uncertainty in the resource estimate and how much the Inferred contributes to the overall tonnage. Sometimes we even break the rules and add together the M+I tonnage with the Inferred tonnage.
The mining engineer needs to juggle all three classifications. Having said that, how much emphasis do we put on the split between the Measured and Indicated tonnages? How much emphasis should be put on the Inferred resource by itself?
Inferred Resources Play a Role
We are all aware of the NI 43-101 restrictions imposed on the Inferred resources in mining studies. They are deemed highly speculative, and hence cannot be used in the economic models for pre-feasibility and feasibility studies. However Inferred resource are used for pit design and production planing in a Preliminary Economic Assessment (“PEA”).
Inferred resources are so speculative that a company is not permitted to add them to the Measure and Indicated tonnages in a resource statement (although that is what every investor automatically does). I don’t really understand that concern in a Mineral Resource statement if it clearly includes a line that adds M+I tonnage with Inferred tonnes – as long as everything is transparent. It provides an easy way to see what portion of the total resource is Inferred.
Its a bit contradictory that when a PEA mining schedule is developed, the three resource classifications can be combined into a single tonnage value. However in the Mineral Resource statement itself, the M+I+I cannot be totaled.
I understand that a company must provide information as to how much of the PEA production schedule is based on Inferred Resources, although often they do not provide this breakdown. Next time you are reviewing a 43-101 report for a PEA, take a look if it is provided.
Are Measured Resources Important?
It appears to me that investors are often more interested in what resource tonnage meets the M+I threshold but are less focussed on the tonnage split between Measured and Indicated.
It seems that M+I are largely viewed as being somewhat the same. Since both Measured and Indicated resources can be used in a pre-feasibility economic analysis, does it matter if the tonnage is 100% Measured (Proven) or 100% Indicated (Probable)?
The NI 43-101 and CIM guidelines provide definitions for Measured and Indicated Mineral Resources, but do not specify any different treatment like they do for the Inferred resources. If Measured has more certainty than Indicated, should we be able to apply their tonnages interchangeably?
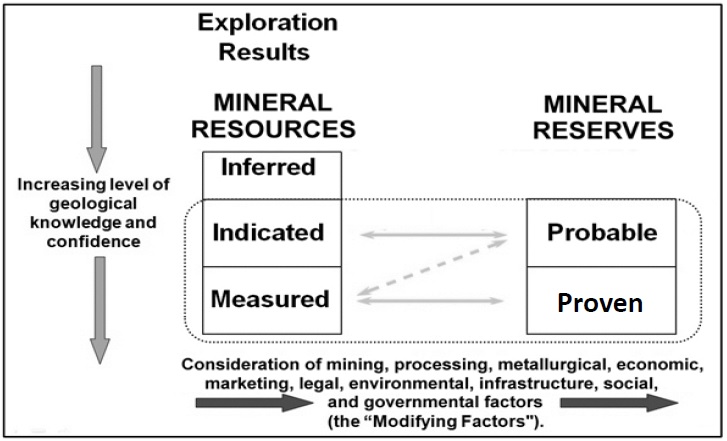
Relationship between Mineral Reserves and Mineral Resources (CIM Definition Standards).
In my experience with some feasibility studies, a few people did apply a rule-of-thumb that the majority of the tonnage mined during the payback period must consist of higher confidence Measure resource (i.e. Proven reserve).
The idea was to reduce project risk by ensuring the production tonnage during the capital recovery period is mining the resource with the highest certainty in tonnes and grade.
Generally I do not see this requirement used that often anymore, although I am not aware of what everyone is doing in every study. It would be good to see more transparency on this in the studies. Perhaps this may explain why some recent projects put into production had difficulty meeting grade targets and then ran into trouble.
I realize there is a cost, and possibly a significant cost, to infill drill to convert Indicated resource to Measured. Hence there may be some hesitation in this approach. Likely it is simpler for everyone to just view the Measured and Indicated tonnages as one. Note that some algorithyms are now available to help optimize infill drill programs to get the most bang for the buck (see this blog pot Let A.I. Help Target Your Infill Drilling).
Conclusion
NI 43-101 specifies how the Inferred resource can and cannot be used. Given some of the project failures, is it a matter of time before the regulators start specifying how Measured and Indicated resources must be used? There is merit to this idea, however adding more regulation (and cost) to an already burdened industry would not be helpful. Ultimately it is up to the mining companies and financiers as to how far they want to see the re-risking step go.
In lieu of more regulations, perhaps in the interest of transparency, feasibility studies should add two new rows to the bottom of the production schedule. These rows would show how the annual mining and processing tonnages are split between Proven (Measured) and Probable (Indicated) categories. This would enable one to can get a sense of the resource risk in the early years of the project.
Given the capabilities of today’s mining software, it is not difficult to provide this additional detail. Companies with a high proportion of Measured in their Feasibility Study can use this a way to promote their de-risking efforts. Now we just need to ensure that the resource estimation consultants actually classify Measured as very high certainty resources.
I don’t want to give the impression that Inferred resources are unimportant. They do play a role in mine design and permitting, as discussed in this post “The Double Life of Inferred Resources: Now You See It – Now You Don’t“.
************

In my opinion the single most important economic variable in a study is how the block model was constructed. More projects are undone by a bad model than by any other factor. (Check out Rubicon for a recent example.) Therefore, it is critical for an investor to understand how the model was constructed…among other things. Another factor most people tend to overlook is that models are not deterministic. They are statistical risk based estimates and are merely blurry reflections of the originator’s knowledge and experience with resource estimation. So it’s good to know who did the model and what his background is.
In the end, the model is simply a model of reality that can be very good or very bad. The designations of MI&I are only one component to the model that an investor has to consider before putting his money down.
By coincidence, I putting together some thoughts for a future blog on the reliability of the QP’s doing the estimates. Unfortunately most investors cannot build their own block model so they have to rely on those QP’s doing the work. Further, investors can not verify the competency of the QP so there is a lot of trust in the system.
I think you misunderstood. You don’t need to build a block model to understand how it was done, although it’s a nice and necessary check for doing due diligence.
Normally the largest section (mineral resource) of a technical report is devoted to how the model was constructed. It’s generally very technical and very boring, but well worth the time to read and understand. The competency of a QP is a required part of the report. Some of the issues I look for are:
block size vs shovel size.
composite length vs block dimensions
normal or log normal distribution?
search radius and elipse orientation
use of domains
number of required samples to interpolate into a block and whether more than one dd hole is required
cumulative probability curve and use of MIK.
These are all things that a resource geologist can play with to enhance his interpretation of tonnes and grade.
After reviewing a few reports a reader gets a good sense of which ones are well done and which ones are not well done. Over time you see the same names coming up on different reports, particularly among the juniors. When I see certain names I read a little more carefully.
A frustrating aspect of technical reports is when an operation does one for their producing mine. These generally have less information than independent reports, particularly in the schedule, cost and economic valuation sections.
I was looking at it from the viewpoint of retail penny stock investor that doesn’t have a mining background. The 43-101 report is pretty meaningless to them and also are the names of the QP’s. Maybe these type of people shouldn’t be investing in the pennies if they aren’t technically savvy and they cannot trust the system. Newsletter writers can fill the information gap, but then some of them are not entirely independent either.
Penny stock investors are probably better off relying on hot tips on bullboards!
Back to your original point on M vs I, it really does make a difference to someone like me because I think about what it means in a number of ways. Of course the risk factor will be higher if there is very little M and lots of I. Then there is the grade factor. Have you ever noticed how for most reports the grade is higher for M, lower for I and lower again for the other I? This is not always the case, but it makes me wonder if grade can be improved by more drilling to move I into the M category. Also, in those cases where the grade of I is higher than M it makes me wonder how well the resource calculation was done.
I have heard this said before – “drill more holes to boost the grade”. Unfortunately tt doesnt work like that. It’s usually because the higher grade min, being the most attractive stuff, was where the greatest attention was paid, so more holes are drilled there to prove it up. The extra holes leads to the M classification. Cause is the greater density of data, effect is the M classification.