A while ago I posted an article about how one can evaluate the economic potential of a gold deposit using early-stage exploration intercepts. That article can be found at this link. Doing the same evaluation for a polymetallic deposit is a bit more challenging. There will be different metals of interest, with variable grades, prices, and process recoveries.
 When disclosing polymetallic drill results, many companies will convert the multiple metal grades into a single equivalent grade. I am not a big proponent of that approach.
I prefer using the rock value, whether calculated as a recoverable “NSR dollar value per tonne” or as an “insitu value per tonne”. Either rock value is fine for my purposes.
Interestingly NI 43-101 prohibits the disclosure of insitu rock value but allows the use of metal-equivalents. In my view this is a bit counter-intuitive since the equivalent grade can be more misleading than rock value.
What can drill intercepts show
 The three aspects that interest me the most when looking at early-stage drill results are:
-
The economic value of the rock (in $/t tonne). This can either be “insitu value” (assuming 100% recovery, 100% payable) or the “NSR value” incorporating recovery and payable factors (if available). Personally, the 100% insitu value is simpler to calculate and assess.
-
The depth to the top of the economic zone, which indicates if this deposit would be a lower cost open pit mine or must be a higher cost underground mine.
-
The length of the economic intervals, which indicates whether bulk mining approaches are viable versus the need to selectively mine narrow ore zones. The economic interval lengths also give a sense for the potential tonnage size (i.e. is it a big deposit or a small one).
There are two types of early-stage exploration data that can be examined with respect to the three items of interest described above. They are (i) the drill hole assay data and (ii) the drill hole "intercepts of interest". I will show an example of each in this post using sample data from an actual exploration program.
One can examine individual drill hole assays to calculate the rock value profile along each drill hole. One can also examine the rock values for the major and minor intervals of interest reported in company news releases.
I normally like to examine both, but the intervals of interest data is publicly disclosed and more readily available. Drill hole assays are often a bit harder, if not impossible, to track down.
Economic Parameters
In a polymetallic deposit, the insitu rock value is simply the summation of value of the individual metal, based on their respective assay grades. An NSR rock value would apply an adjustment for metal recoveries and smelter payables, thereby lowering the insitu rock value somewhat. However the insitu value is fine if there is no metallurgical or process data to rely upon.
Next one must determine what insitu rock value is deemed potentially economic, i.e. the breakeven cutoff.
One can estimate a processing cost and G&A cost. In an open pit scenario, one doesn’t include the mining cost since the goal is to decide whether to send a truck to the waste dump or to the crusher. Only the processing and G&A cost musts be recovered by the ore value. In an underground mining scenario, one would include the mining cost in the cutoff calculation.
In our example, lets assume a unit processing cost of $12/t and a G&A cost of $$2/t, for a combined cost of $14/t. If we envision a metal recovery range of 75%-95%, we can assume 85% for now.
If we envision a smelter payable range of 75% to 95%, we will assume 85% for that also.
 The “NSR factor” would now be 85% x 85% or 75%. Therefore, if the breakeven cost is $14/t, then one should target to mine rock with an insitu value greater than $20/tonne (i.e. $14 / 0.75). This would be the approximate ore vs waste cutoff. It is still only ballpark estimate at this early stage, but good enough for this type of review.
Normally it would be nice to see the average head grade (or rock value) at 3 to 4 times greater than the cutoff grade. This is not a necessity but it is a positive factor.
For example, in a gold deposit with a 0.3 g/t cutoff, one would like to see average head grades at least 0.9 to 1.2 g/t or more. If the average head grade is close to the cutoff grade, then possibly the orebody tonnage may be very sensitive to changes in cutoff. This may not be a good thing.
In our example, with a breakeven cutoff rock value of $20/t, one would like to see some ore zones with insitu values 3-4x higher, or above $60 - $80/t. We can target >$70/t rock as a "nice to have" with $20/t as the cutoff.
So far, its all pretty simple. Let’s look at some actual exploration data to see how to apply this approach.
Our example will be a polymetallic deposit containing four metals of interest; copper, gold, cobalt, and iron. One can examine a few drill holes as well as the intervals of interest.
Metal prices used in this example are Cu = $4/lb, Au = $1980/oz, Co = $15.50/lb, Fe concentrate = $100/tonne, assuming 100% recovery and 100% payable for everything.
Drill Hole Assays Examples
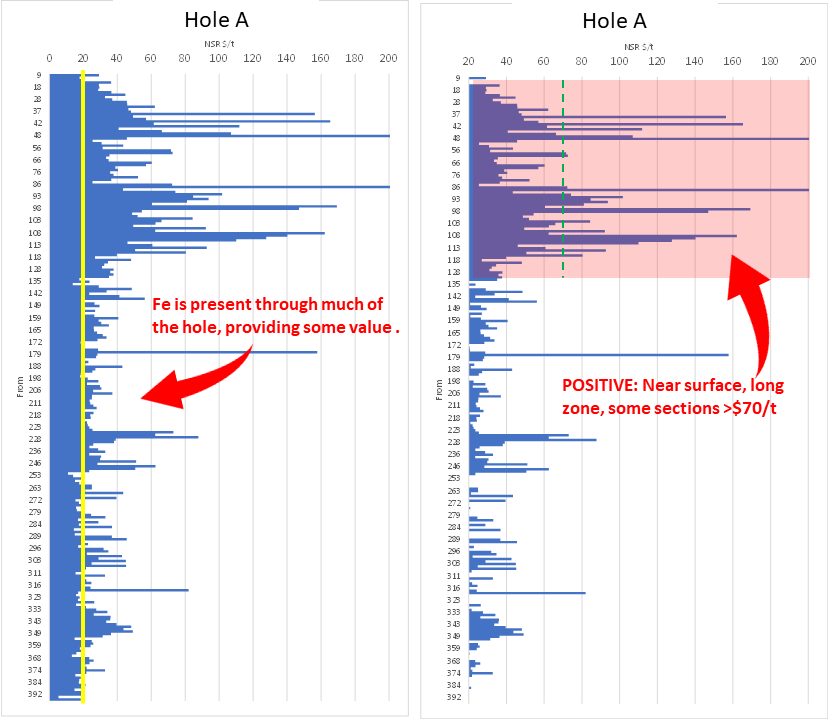
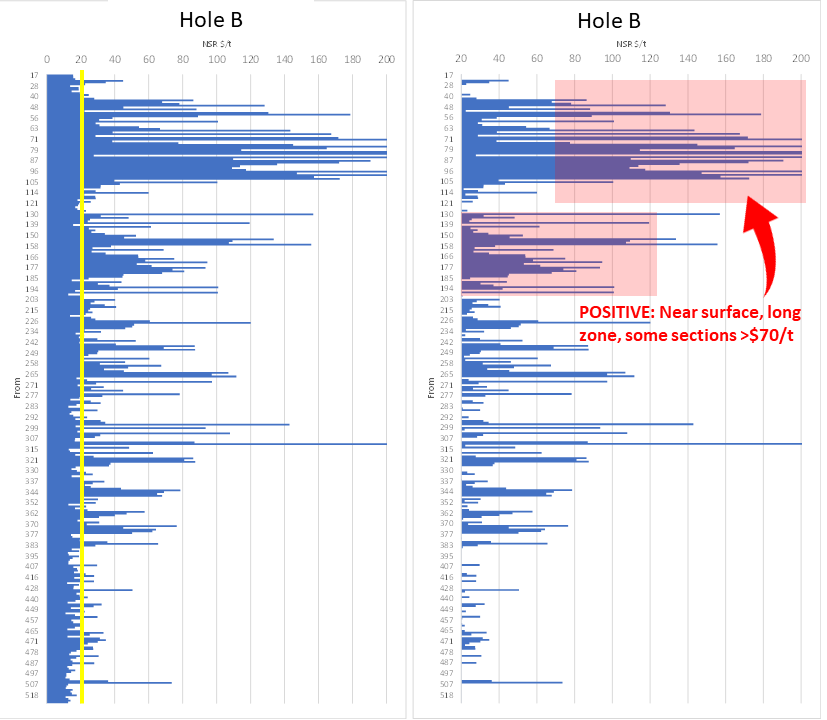
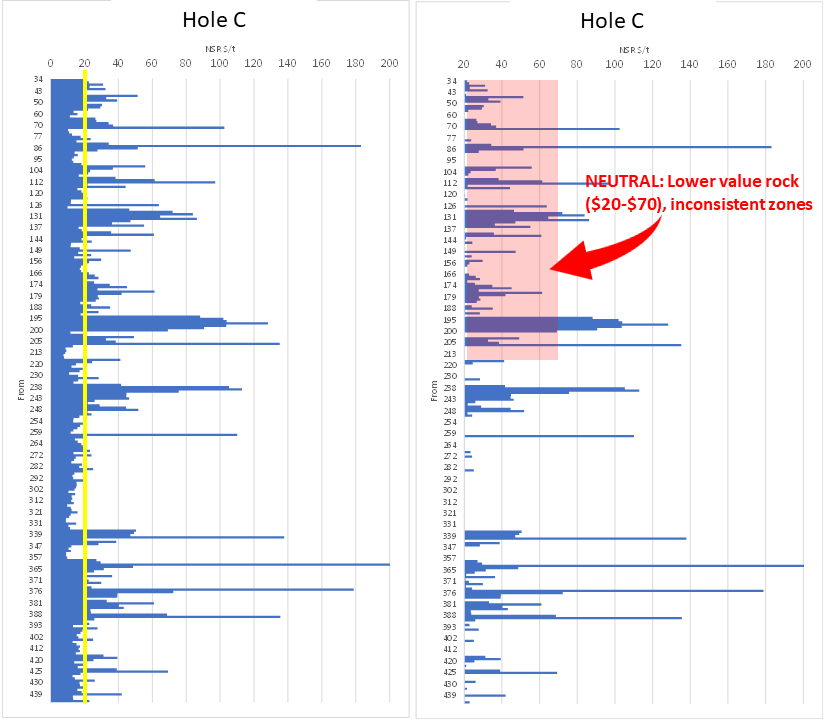
The following three graphs show down hole profiles for Drill Holes A, B, C. For each hole there are two plots. One plot shows the insitu rock values down the hole. The second plot is the same, except the x-axis minimum has been set to the breakeven cutoff value of $20/t. This is done simply to highlight the potentially economic zones.
Hole A:
Shows positive economic results with ore quality rock starting near surface and extending down to 120 metres.
While many of the assay values are between $20-$70/t there are a significant number exceeding $70/t.
This hole has good economic potential for production.

Hole B:
Shows positive economic results with economic rock starting near surface. There are multiple economic zones extending all the way down to 370 metres.
The upper part of the hole, from 40m to 100m, shows multiple assay values exceeding the $70 target.
A second potentially economic zone is seen at a depth of 130m to 190m, which is still within the open pit mining range.
This hole also has good economic potential.

Hole C:
For comparison purposes, Hole C is neutral in that while there are multiple potentially economic zones, they have lower insitu value.
This hole doesn't have the economic consistency that was seen in Holes A and B.
Possibly this hole may be near the edge of the ore body, in which case such a profile is not unexpected.

Normally I would not spend a lot of time examining holes with little to no grade. Some may consider this as a biased view. However, every orebody has its limits, and what is occurring along the edges isn’t that critical in my view.
My objective is to understand what is happening in the core of the orebody, since that is what will dictate the overall economics. Is the core of the orebody marginal value, or does it consist of high value rock? Ultimately it will be the exploration company's task to keep drilling to define if there is sufficient tonnage of this higher value rock to justify a mine. However this shows that at least the grades are there.
Intervals of Interest Example
The next series of plots examines the insitu rock values over drill intervals typically published in a company news releases. The intervals of interest will composite the individual assays over larger widths based on the company’s technical judgement.
It is interesting to see whether the larger intervals have good economic potential. The following charts combine both major intervals with minor zones, often referred to as “including” in news releases. Both major and minor intervals can provide useful information.
Insitu Rock Value vs Depth:
This chart shows the rock values for multiple report intervals versus their depth (top) along the hole.
One can see multiple intervals at open pit depths (<250 m) with insitu values above the $20/t cutoff and above the $70/t threshold.
Within the upper 250 metres, we are seeing multiple intervals with good value. That is a positive sign.
Note that these depths are not depths from surface, but distance along the drill hole. In reality the intervals may be slightly closer to surface, depending on the hole inclination.

Insitu Rock Value vs Interval Length:
The next question to ask is whether the higher value zones are narrow or wide?
In the example here one can see some wide zones (70 to 90m) with rock values in the range of $40-70/t. These are good open pit mining widths.
There are numerous higher grade zones ($70-$200/t) in the 5m to 20m width range. These widths are still fine for open pit mining.
Some intervals are quite narrow (<5m), being a bit more difficult to mine. Since many of these are higher grade, they will tolerate some mining dilution.

Conclusion


 This might be better than each company applying their own unique equivalent grade calculation to their exploration results.