


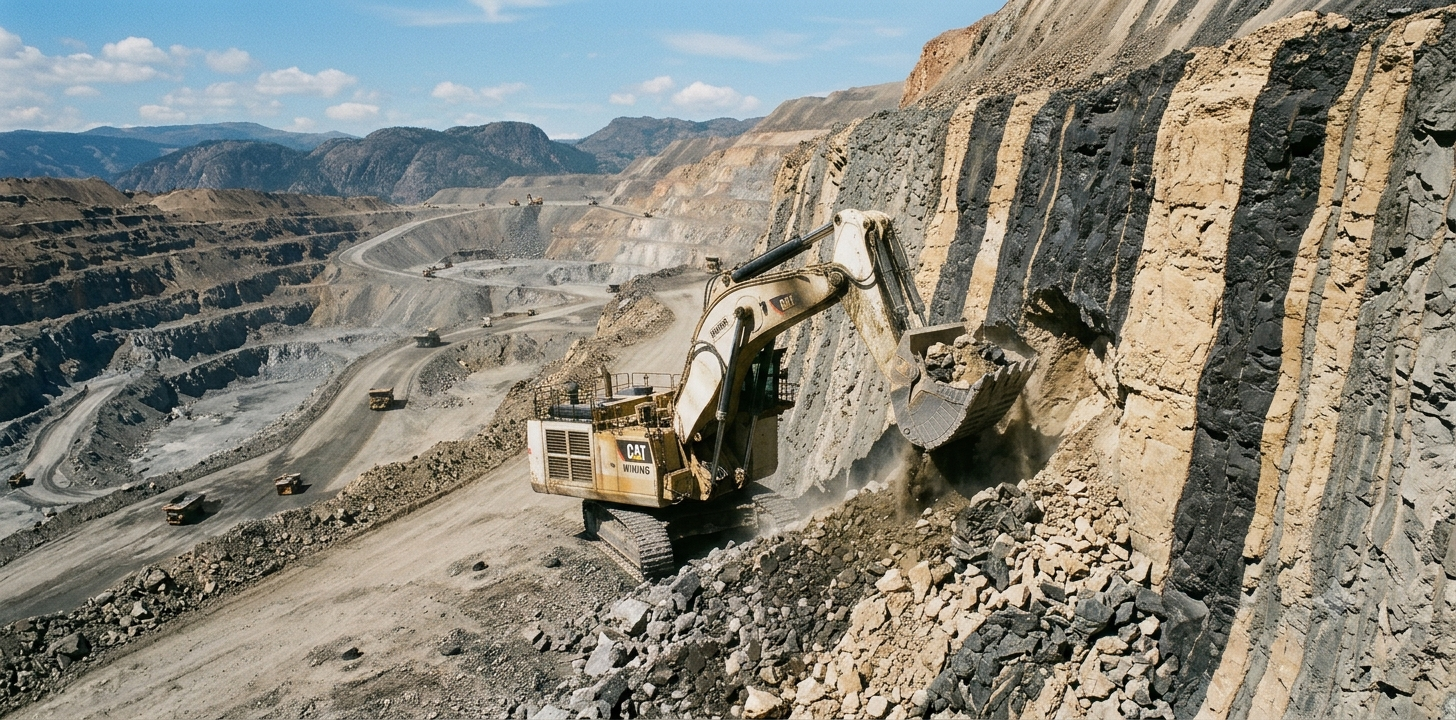
 Over the years of working on studies and reviewing them, ore dilution often does not see much discussion but it is one of the most important technical and operational issues. It plays a key role in the success of a mining operation, particularly underground operations. In studies, it can be too low or too high, too optimistic or too pessimistic.
Project economics (NPV, IRR) can see significant impacts depending on the applied dilution factor. They are numerous instances where mines have been put into production, and excess dilution has subsequently led to their downfall. At the West Red Lake Madsen mine, gold head grades were forecast to be around 7-8 g/t (2025 PFS Table 22-1) but in reality production head grades are closer to 3.5-4.3 g/t (July 15, 2026 NR). Is this due to dilution or a change in mining plans – I don’t know – but dilution could be part of the reason.
Hence mine designers need to take the time to think about what dilution will be applied in the production forecast and the basis for that decision.
Everyone has a preferred dilution method.
Dilution is the mixing of waste with ore during mining, sometimes by design and sometimes unavoidable, but never desired. It must be applied in the mine plan to forecast the head grade that the processing plant will see. Over the years I have seen several different approaches for modelling and applying dilution in a mining study.
It seems that engineers and geologists have their own personal favorites and tend to stick with them. Here are some common dilution approaches that I have seen (and used myself).
1. Pick a Number:
This dilution approach is quite simple and sometimes used in very early stage assessments. Just pick a number that sounds appropriate for the orebody and the mining method. There might not be any solid technical basis for the dilution value, but as long as it seems reasonable, it might go unchallenged. Possibly one uses a dilution value commonly seen in other studies.
2. SMU Regularization:
This dilution approach takes each resource model percent block (e.g. a block is 20% waste and 80% ore) and mathematically regularizes it into a single Selective Mining Unit (“SMU”) block with a weighted average grade. The SMU compositing approach will dilute the ore in the block with the contained waste. Ultimately this step might convert some highly diluted ore blocks to waste once a cutoff grade is applied. Internal ore blocks that are 100% ore would not be diluted. Some engineers may apply an additional dilution factor beyond this SMU compositing to be safe, while others will consider the block model fully diluted at this step and move onto scheduling.
3. Diluting Envelope:

This dilution approach assumes that a 1 to 3 metre wide waste envelope surrounds the ore zone. It assumes that the envelope will be mined along with the ore. The width of the waste envelope may be based on the blast hole spacing used to define ore and waste contacts for mining.
The diluting grade of the waste envelope can be estimated or one may simply assume a more conservative zero-diluting grade. In this approach, an average dilution factor can be applied to the final production schedule to arrive at the diluted tonnages and grades sent to the process plant.
With this approach, narrow orebodies would be diluted more heavily than bulk orebodies.
4. Diluted Block Model:
This dilution approach uses more complex logic to look at individual blocks in the block model. One determines how many waste contact sides each block has, and then mathematically applies dilution based on the number of those contacts. A block with waste on three sides would be more heavily diluted than a block with waste only on one side an edge block). Usually this approach relies on a direct swap of ore with waste being neighboring blocks. If a block gains 100 m3 of waste, it must then lose 100 m3 of ore to maintain the volume balance. The production schedule derived from such a “diluted” block model usually applies no subsequent dilution factor. Sometimes it can be complex to quantify the % dilution from this approach.
5. Using UG Stope Modelling
I have also heard about, but not yet used, a method of applying open pit dilution by adapting an underground stope
modelling tool. By considering an SMU as a stope, automatic stope shape creators such as Datamine’s
Mineable Shape Optimiser (MSO) can be used to create wireframes for each mining unit over the entire
deposit. Using these wireframes, the model can be sub-blocked and assigned as either ‘ore’ (inside the
wireframe) or ‘waste’ (outside the wireframe) prior to optimization.

When is the Cutoff Grade Applied?
Depending on which dilution approach is used, the cutoff grade will be applied either before or after dilution. When the dilution approach requires adding dilution to the final production schedule, then the ore / waste cutoff grade will be applied to the undiluted block model (approach #1 and #2).
When dilution is incorporated into the block model itself (#3 and #4), then the cutoff grade is applied to the diluted blocks.
The timing of when the cutoff grade is applied to the model will have an impact on the ore tonnes and head grade being reported.
Applying dilution in pit optimization?
Another occasion when dilution may be applied is during pit optimization. In the optimization software, there are normally input fields for both a dilution factor and an ore loss factor. Some engineers will apply an estimated dilution at this step while others will leave the factors at zero. There are valid reasons for either approach.
My preference is use a zero dilution factor for pit optimization since the character of the ore zones will be different at different revenue factors; hence dilution would be unique to each. It would be good to examine the impact that the dilution factor has on pit optimization by running with and with to see the results.
Conclusion
 The goal of dilution estimation is not to demonstrate fancy mathematics, but to forecast what it will actually be. My personal experience is that people tend to focus on the value of the dilution percentage and whether it seems reasonable in the end. There seems to be less focus on the logic for the dilution approach used. It is not easy to forecast dilution yet it can be an incredibly important number.
Regardless of which approach is being used, ensure that one can quantify the percent dilution being applied – is it 5% or 20% dilution?
Others may yet have different dilution methods in their toolbox and it would be interesting to hear about them.
Another blog post discusses dilution from an underground mining perspective in a bit more detail. This discussion was written by another engineer who permitted me to share their paper. You can read that blog at “Ore Dilution – An Underground Perspective“.
Note: You can sign up for the KJK mailing list to get notified when new blogs are posted. Follow me on Twitter at @KJKLtd for updates and other mining posts. The entire blog post library can be found at https://kuchling.com/library/
For some free mining calculator apps, including project timelines and a simplified cashflow modeller, check out this website https://sites.google.com/view/drillingdown

Hi Ken, It’s been a while since I’ve visited your site. Nice to see you’ve continued your blog.
Dilution is difficult to measure in most mines, particularly in open pits, and this is why (I think) there are so many different ways to put a decent estimate on it for the resource or reserve models. Add to this the fact that reserve models can be highly inaccurate on an annual measurement basis, or even on a life of mine basis, which means any attempt to measure dilution is highly subjective.
Nevertheless, everyone knows that some estimate is required, else they will be questioned by their superiors as to why they didn’t include it. At the end of the month no one wants to see less metal produced than predicted by the plan. Positive surprises are always good but negative ones cause VP’s to issue directives to sort the problem out.
When I do pit optimizations I usually include a small percentage for dilution and ore loss. My numbers are probably pie in the sky wrong but I know they will occur at some level so why not acknowledge their reality? Models are most reliable when they are at least close to reality.
I’ve bookmarked your site and will try to get caught up on some of your blog posts. Being recently retired, I have a bit of time on my hands!
Thanks for the comments. Its been awhile since I wrote a blog since I ran out of topics to write about (and motivation). I have a small backlog of topics but sometimes the motivation isn’t there to work on them. I’m semi-retired and now have some time, so starting to go through my old blogs, modernizing them, making a few edits here and there, fixing missing links.
Dilution is a funny one, everyone has opinion when the number is obviously wrong but tougher to come up with the correct number that should be used.