

 Every few weeks we see another feasibility study completed. Normally the numbers will look fantastic. The feasibility study shows that a project could work, but will it really work?
A positive feasibility study is the moment a mining project is supposed to come alive. It’s the point where geology, engineering, and economics merge into a real (i.e. bankable) business case. However, it is also the starting point of an entirely different and more difficult path.
The roadblocks between a feasibility study and a producing mine can be numerous, varied, and often have nothing to do with the geology itself. A government can change the tax regime, or a community can withdraw support. The commodity prices can turn, or environmental permits can be challenged in court. A company’s own board can lose conviction. Understanding this development gauntlet is the difference between allocating capital to projects with returns and those that will consume capital for a decade.
 Stalled projects will experience several of the roadblocks simultaneously. A single roadblock might be surmountable, but multiple roadblocks may not be.
Many of these roadblocks will be identified during confidential third-party due diligence by potential partners, acquirers, or financiers. Hence investors may never learn the actual truth as to why the project is stalled and are left guessing why.
I have been part of due diligences on behalf of lenders and have seen the negative reasons never make it to the public eye. Sometimes the company may itself not know why a project was declined, although they can make an educated guess.
The following is a checklist of the various pitfalls leading to the study graveyard. Check off all those that you think apply to your favorite stalled project. Be honest. Typically, more than one will apply and they will tend to compound.
Geotechnical & Geological Risk
-
Review of the block modelling reveals concerns with grade, continuity, or metallurgical recovery.
-
Review of the expected geotechnical conditions reveals mining concerns associated with faulting, weak ground, karst, high water inflows.
-
Metallurgical complexity understated in feasibility (refractory ore, penalty elements).
-
Resource classification is suspect and a lot more infill drilling is required, at a high cost.
-
Hydrology issues, e.g. acid rock drainage severe and difficult to manage long term and becomes a corporate liability.
Technical & Engineering
-
Feasibility study found to be technically flawed upon review.
-
Project is very complex and will be difficult to build on budget and on time, as well as difficult to staff with qualified operating personnel.
-
Processing technology unproven at scale, ore sorting risk ,etc.
-
Infrastructure assumptions (power, water, road) prove more costly or difficult.
-
Mine plan optimistic on strip ratios, mining rates, or equipment productivity.
-
Tailings storage facility design issues, high risk, or siting problems.
-
Water rights access insufficient or contested.
-
Offsite infrastructure (road, rail, or port) inadequate and too costly to build.
-
Remoteness – labor costs and retention problems underestimated.
Permitting, Regulatory, and Social License
-
Environmental impact assessments likely to be rejected or endlessly delayed.
-
Perceived difficulties to get operating licenses, water licenses, or discharge permits.
-
Regulatory framework uncertain and changes mid-process (new environmental laws, mining codes).
-
Federal/state/provincial jurisdictions overlap creating jurisdictional gridlock.
-
Permits granted but successfully challenged in court by third parties.
-
Indigenous or First Nations consultation failures, failure to negotiate community benefit agreements acceptable to all parties.
-
Local community opposition leading to blockades or political pressure.
-
NGO campaigns attracting negative media attention that spooks investors or lenders.
-
Religious, cultural, or heritage site conflicts with site plan.
-
Mineral title disputes persist with overlapping claims or historical issues.
-
Land access agreements with surface rights owners difficult to acquire.
Political & Country Risks
-
Government instability, coup, or change of administration hostile to mining.
-
Retroactive tax increases, windfall profit taxes, or royalty rate changes.
-
Nationalization or forced renegotiation of mining agreements.
-
Corruption demands that the company is unwilling to meet.
-
Sanctions, war, or civil unrest making the region inaccessible.
Financing & Capital
-
Inability to secure project financing (debt or equity) due to financier risk appetite, commodity price outlook, or lender requirements.
-
Cost overruns discovered during reviews that make the economics unviable.
-
Declining commodity prices between feasibility and financing.
-
Owner balance sheet too weak to fund large construction; inability to attract a joint venture partner.
-
Royalty or streaming deals entered into that are too dilutive, making equity unattractive.
Corporate & Strategic
-
Management change leading to strategy pivot away from the project. The internal champion is gone.
-
Company acquired by a buyer with a different portfolio strategy — project shelved.
-
Board loses conviction or knows they cannot manage this; project deprioritized in favor of capital returns or other assets.
-
Key technical personnel depart, taking institutional knowledge with them.
-
High market cap of owner makes the acquisition cost high, when considering the capital cost to build must also be incurred by the acquiror. This will lower the return.
Market & Macro
-
Commodity price collapse, or forecasting an oversupply, makes the project sub-economic even with a positive study.
-
Input cost inflation (energy, steel, labor, reagents) erodes profit margins.
-
ESG-driven investor exclusions make it impossible to raise equity capital.
-
Offtake agreements cannot be secured on acceptable terms. This can be important in industrial and battery mineral projects. This may require focusing on downstream processing into upgraded specialty products, increasing risks and costs.
Conclusion
 The list of potential production roadblocks is extensive. Moving from the study stage to production is very difficult and very few can do it successfully. A positive feasibility study is a necessary but far from sufficient condition for production.
When projects stall, it is likely due to multiple factors listed above. A ranking analysis may conclude the compounding effects of the perceived risks makes the project a no-go for financiers.
Some people will say be thankful that more projects don’t advance to production, because we would likely see more failures as the risks come to bear Ideally only the best projects are moving forward, but even there we can see mixed results.
Due to the upcoming shortages of < insert critical mineral > we need more exploration and more discoveries. Given the number of idle feasibility stage projects now, who is to say that these new discoveries won’t see the same roadblocks that the current projects are seeing. Real mining is a tough business – doing studies isn’t.


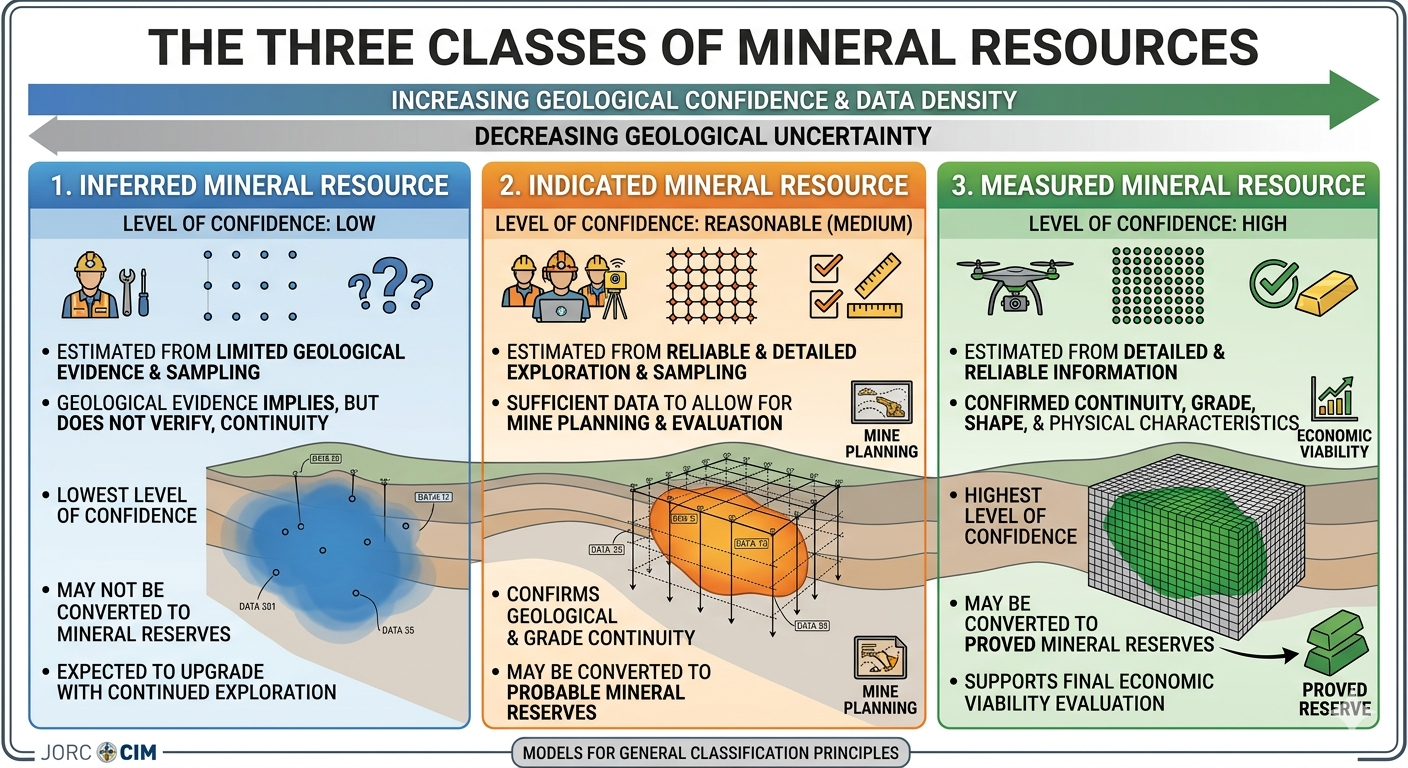 Inferred resources represent the lowest confidence category of mineral resources; typically estimated in zones with limited sampling and unconfirmed geological continuity. They carry the highest geological uncertainty of the three resource categories.
 Companies sometimes will commence the permitting process based on their PEA study. There are some risks to doing this, and the Inferred resource creates one of these risks.
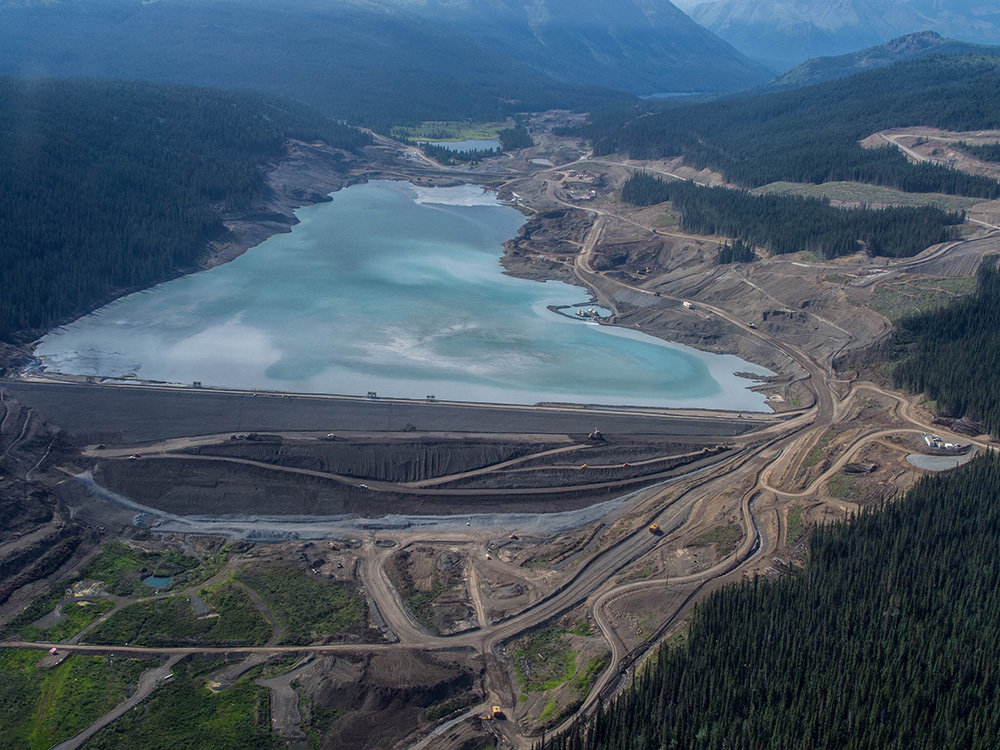 Let us examine some specific aspects of permitting that can be influenced by Inferred resources.
 Inferred resources present a unique paradox; they can and can’t be used in mining economic analysis. They can be used to examine project viability but can’t be used to make a production decision.
 Is the concept of optimization the most important factor in a project’s design? If so, which aspect is the most important to optimize? A danger is optimizing for a single criteria, for example NPV, at the expense of everything else. Selecting the optimal design for one aspect will likely result in being sub-optimal in some of the others.
 Optimization of a mining project can yield meaningful cost and efficiency gains. However mines face inherent constraints, such as ore grade variability, geological surprises, equipment life cycles, and regulatory issues.
 If one decides to pursue the path of operational flexibility, what are the things that help make it happen?
 Rather than focus on constant optimization in design, it may be wiser to focus on a flexible design. Adaptability, flexibility, and resilience may be more important than being fully optimized.
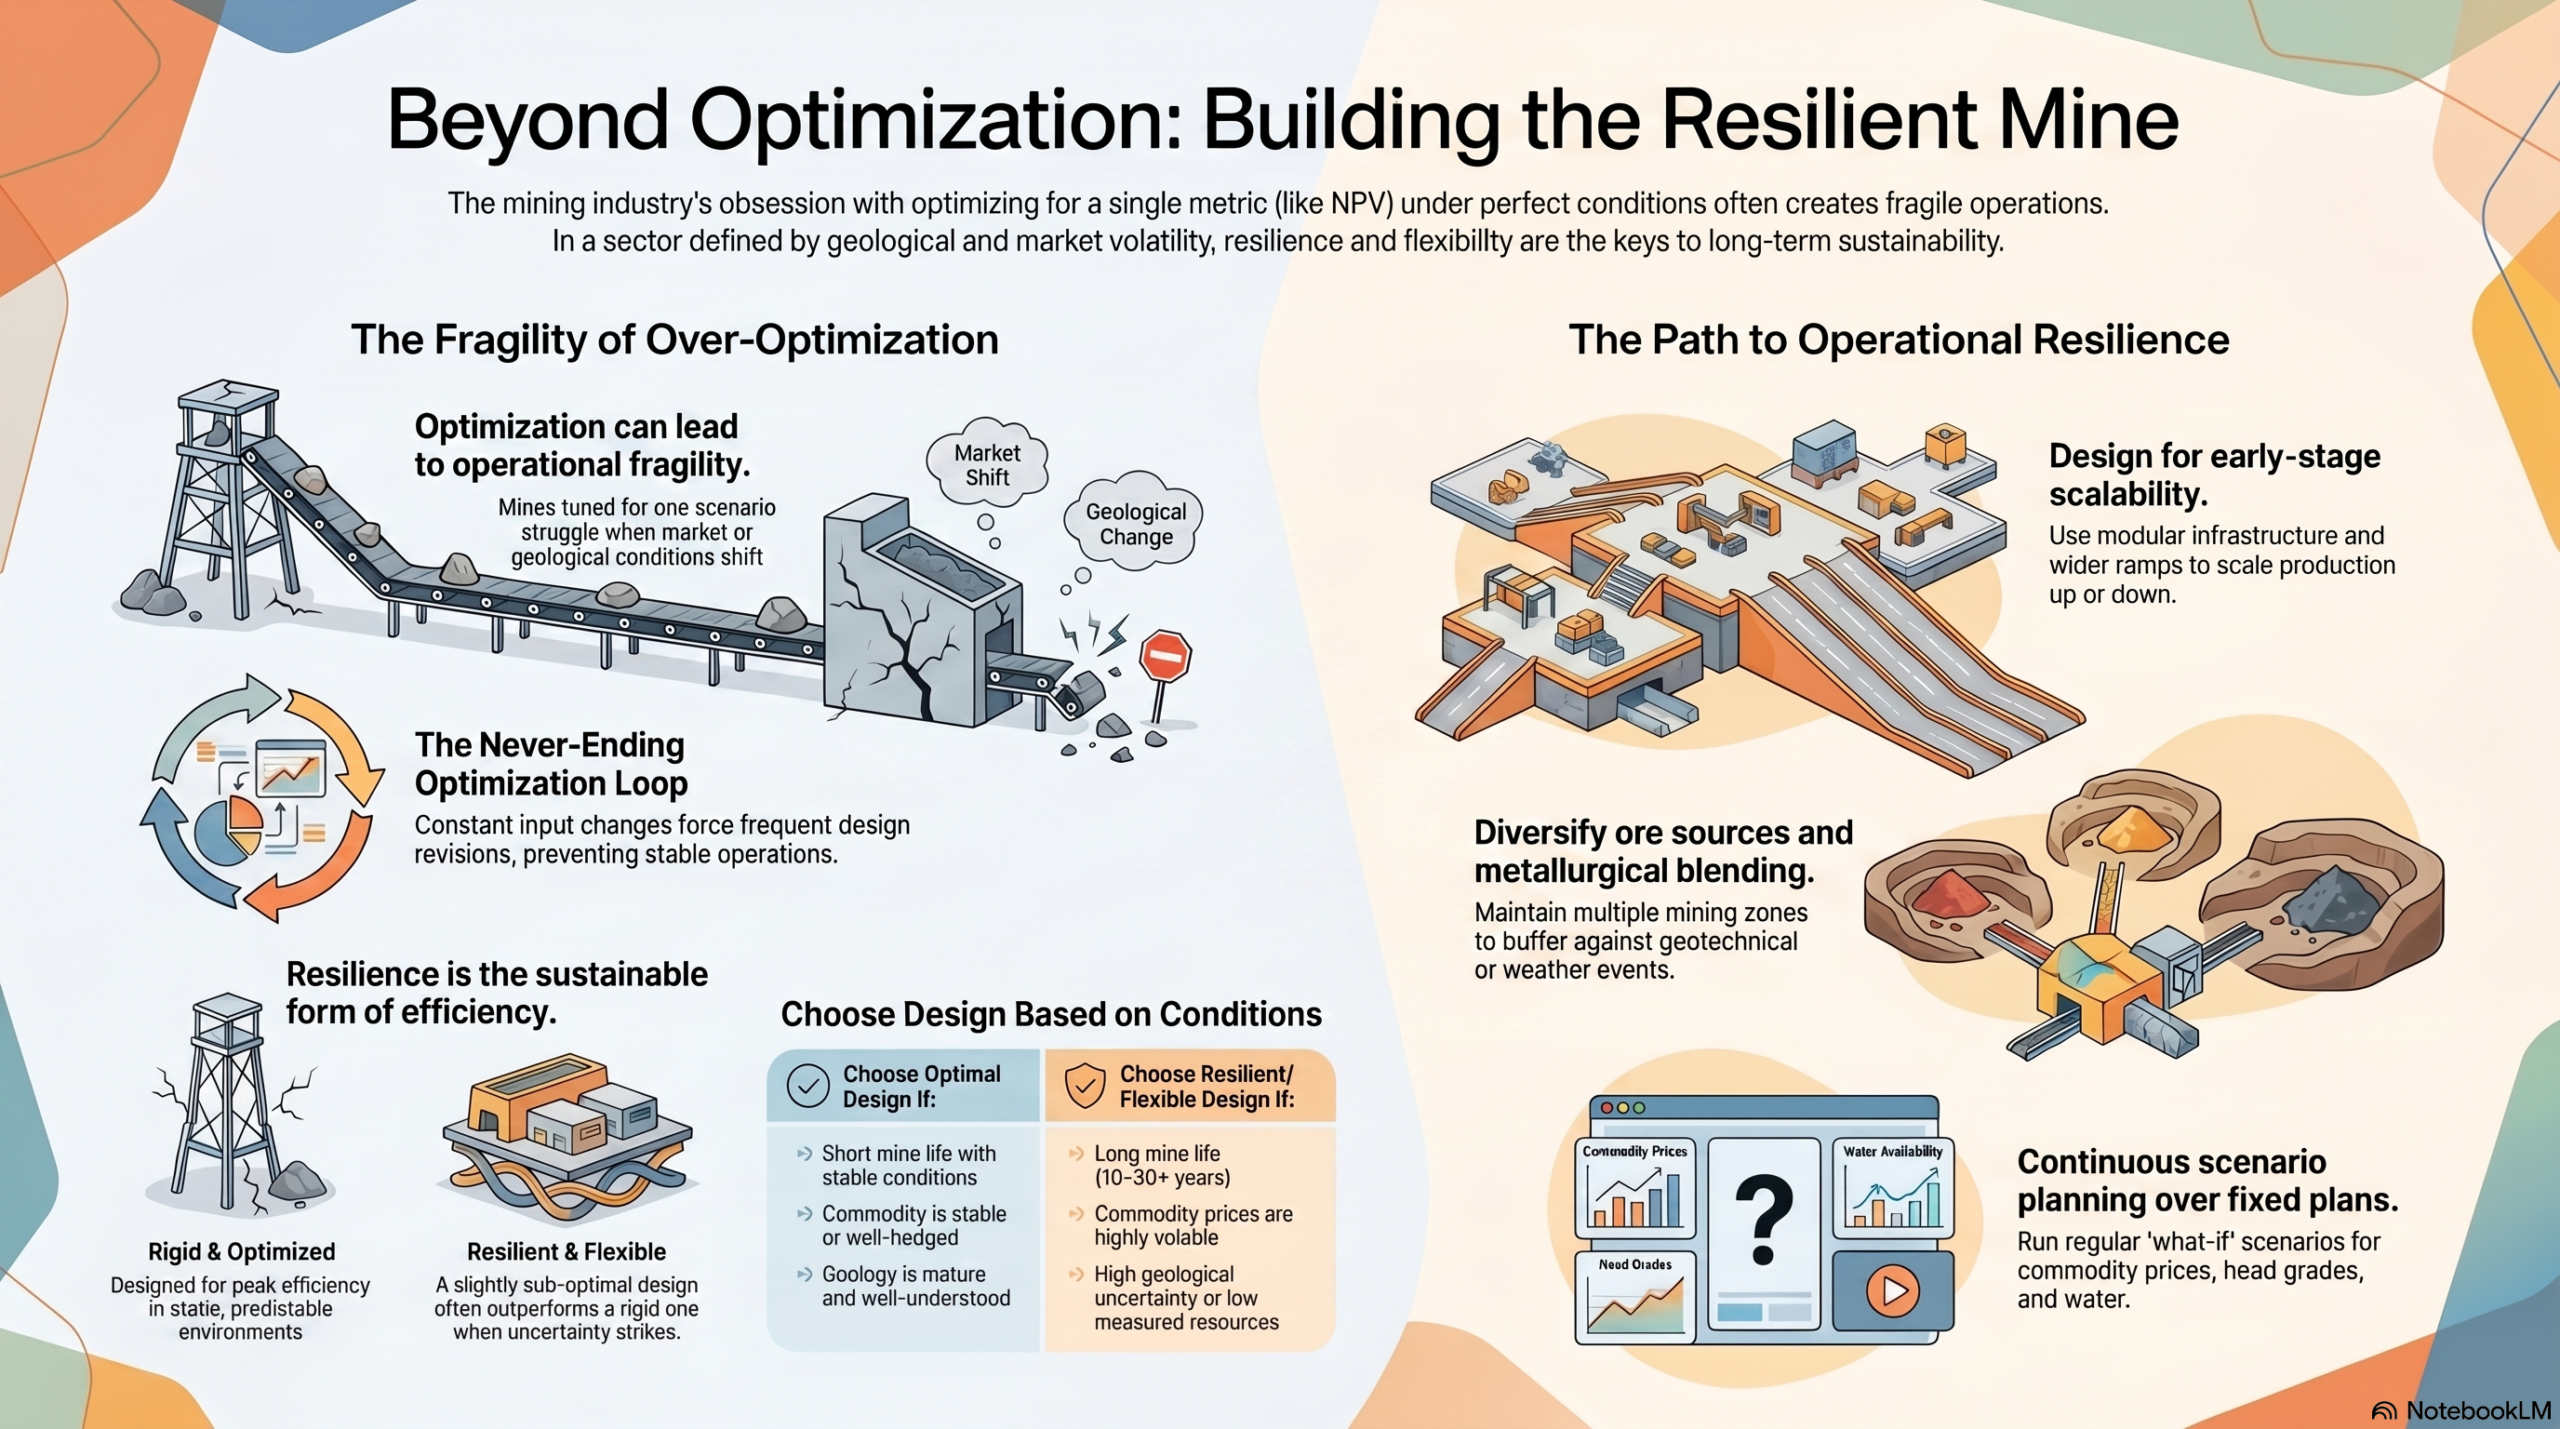

 Recently I have been seeing more mining studies proposing to use the dry stack approach. In some cases, they no longer even do the typical tailings trade-off study that look at different options. The decision is made upfront that dry stack is the preferred route due to its environmental acceptability and positive perceptions.
 The Guide covers several topics, including tailings characterization; site closure concepts; filtered tailings stack design; material transport, stacking systems; and tailings dewatering methods. The Guide covers all the basics very well. The one area that jumped out at me is the tailings characterization and testing aspect.
 Major miners, such as BHP and Rio Tinto, typically spare no expense on material testing for metallurgical or geotechnical purposes. They have the funds available to test and engineer to a high level to adequately de-risk the project to meet their investment thresholds.
 So, you just completed your initial PEA cashflow model and the resulting NPV and IRR are a little disappointing. They are not what everyone was expecting. They don’t meet the ideal targets of an IRR greater than 30% and an NPV that is more than 2x the initial capital cost. The project could now be on life support in the eyes of some.
 The discounting of cashflows in a cashflow model means that up-front revenues and costs have a bigger impact on the final economics than those far off in the future. This effect is amplified at higher discount rates.
 ake to the cashflow model. Sometimes several of the small ones, when compounded together, will result in a significant impact. Here are some of the other cashflow model adjustments that I have seen.
 Don’t let a disappointing NPV get you down. There may be a few ways to boost the NPV by applying some common practices. However, if after applying all of these adjustments, the NPV still isn’t great, something bigger may be required. That could be an entire project scope re-think.
 Part 2 of this blog post will focus on the remaining engineering work to finish Chapter 16 of the Technical Report. We only wrote about half of it in Part 1. The mining engineer can generally handle the rest of these tasks in this Chwithout requiring a lot of external input. You can read Part 1 at this link “
 Two dilution approaches are common. One can either construct a diluted block model; or one can apply dilution afterwards in the production schedule. I have used both approaches at different times.
 Sometimes lower grade stockpiles are built up by the mine each year but only processed at the end of the mine life. Periodically the ore mining rate may exceed the processing rate and other times it may be less. This is where the stockpile provides its value, smoothing the ore delivery to the plant.
 Once the production schedules are finalized, they are normally reviewed by the client for approval. The strip ratio and ore grade profile by date are of interest. One may then be asked to look to at different stockpiling approaches to see if an NPV (i.e. head grade) improvement is possible.
 The last task for the mine engineer in Chapter 16 is estimating the open pit equipment fleet and manpower needs. The capital and operating costs for the mining operation will also be calculated as part of this work, but the costs are only presented in Chapter 21.
 The support equipment needs (dozers, graders, pickups, mechanics trucks, etc.) are typically fixed. For example, 2 graders per year regardless if the annual tonnages mined fluctuate.
 These two blog posts give an overview of some of the things that mining engineers do as part of their jobs. Hopefully the posts also shed light on the amount of work that goes into Chapter 16 of a 43-101 report. While that chapter may not seem that long compared to some of the others, a lot of the effort is behind the scenes.
 When people asl what I do and learn that I’m a mining engineer, I’ll normally get perplexed looks. Most people don’t even knew the job exists
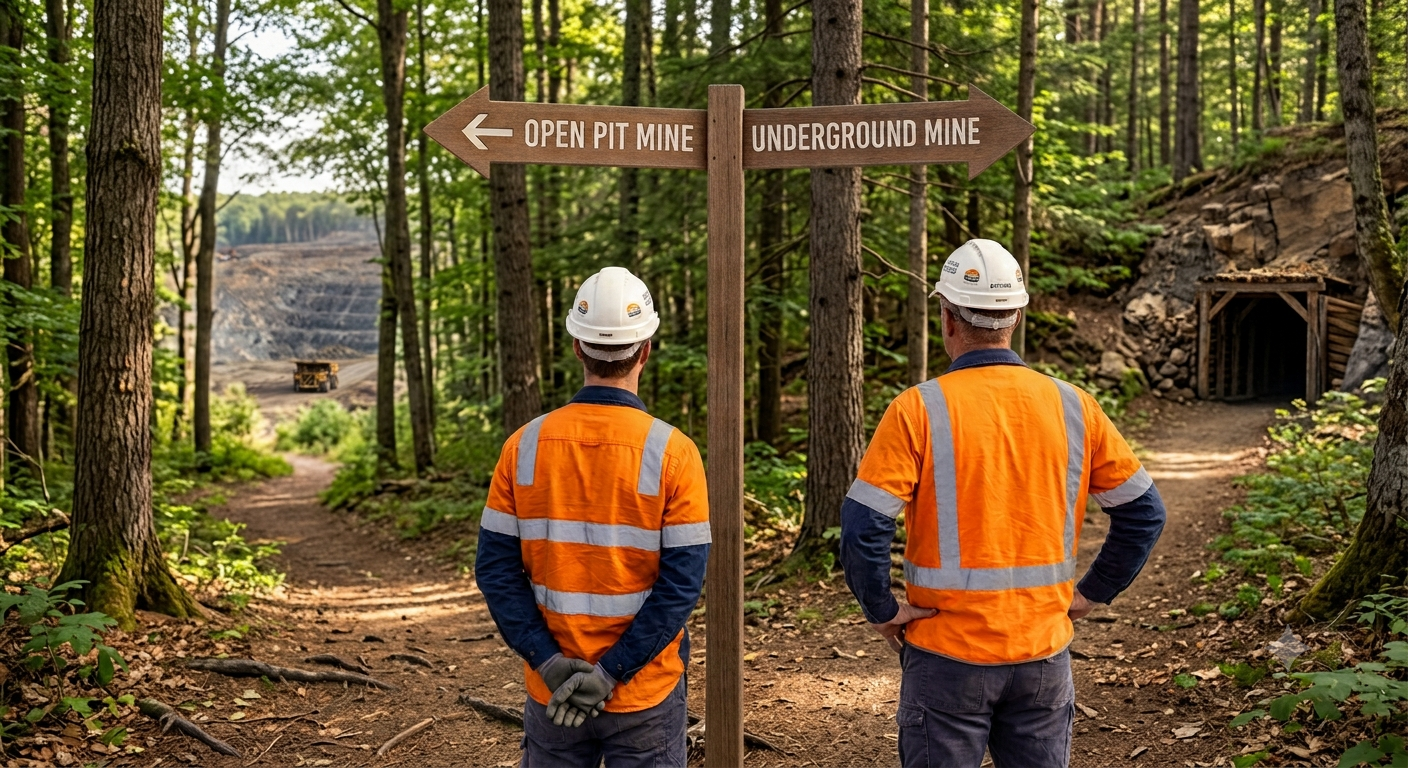
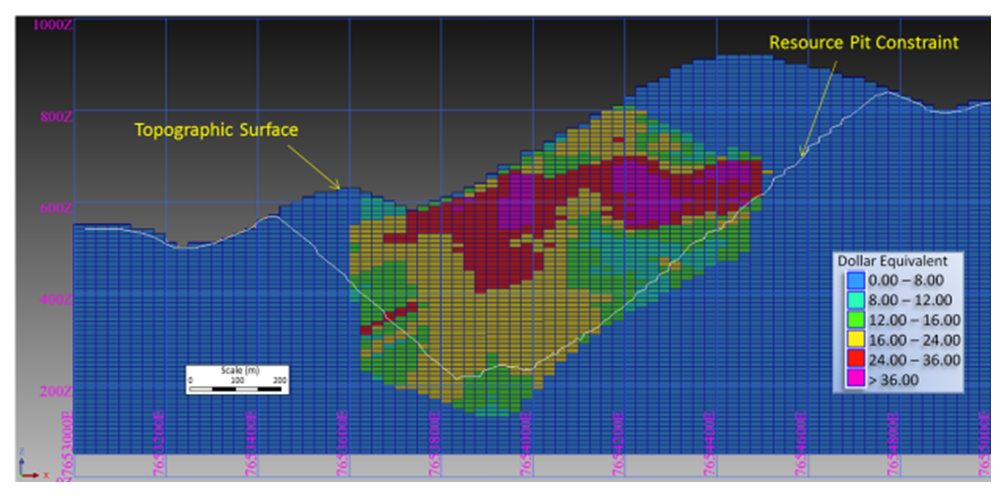 There is always a mineral resource estimate available before doing a PEA. The way the resource is being reported will indicate what type of mine this likely is. The geologists have already done some of the mining engineer’s work.
 Before starting pit optimization, we require economic inputs from several people. The base case metal prices must be selected (normally with input from the client). The mining operating cost per tonne must be estimated (by the mining engineer). The processing engineers will provide the processing cost and recovery for each ore type.
 Once the optimization is run, a series of nested pit shells are created, each with its own tonnes and grade. These shells are compared for incremental strip ratio, incremental head grade, total tonnes, and contained metal.
 The mining engineer is now ready to undertake the pit design. The pit design step introduces a benched slope profile, smooths out the pit shape, and adds haulroads. Hence a couple of key input parameters are required at this time. The mining engineer will need to know the geotechnical pit slope criteria and the truck size & haul road widths. Let’s look at both of these.
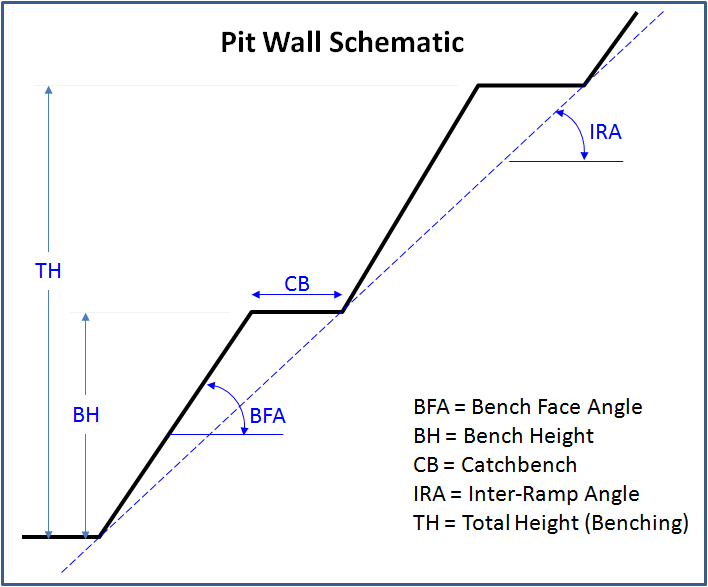
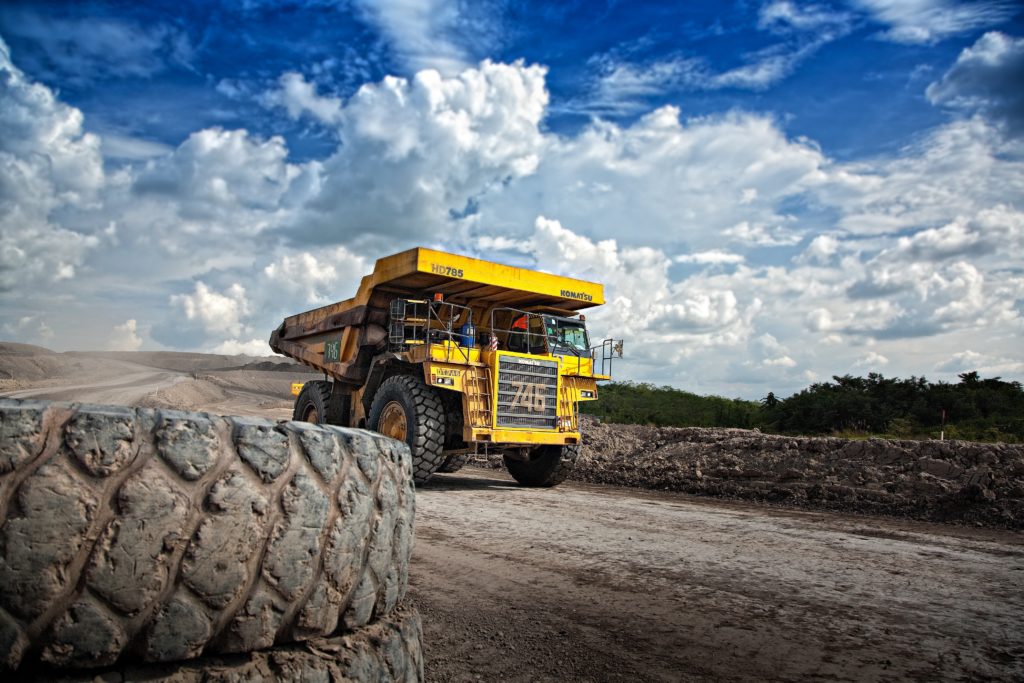 Ramps: Next the mining engineer needs to select the truck size, even though the production schedule has not yet been created.
 This ends Part 1. In Part 2 we will discuss the mining engineer’s next tasks; production scheduling; waste dump design; and equipment selection. The mining engineer QP will sign off and take responsibility for all the mine design work done so far. You are probably wondering why you didn’t select mining engineering as a career. Part 2 is at this link “
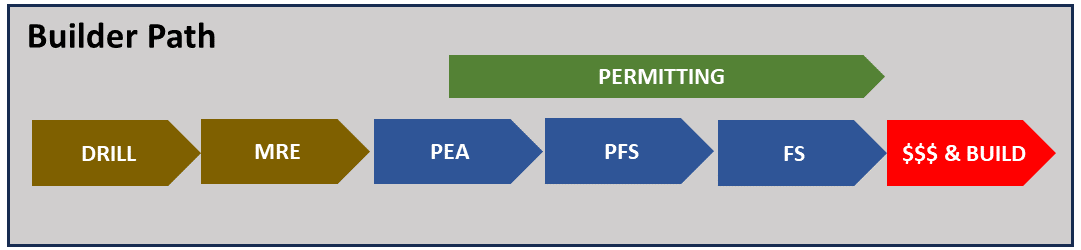


 If an engineer understands that a Mine Builder’s project will move from PEA to PFS to FS in rapid succession, then there is more incentive to ensure each study is somewhat integrated.
 As an engineer, it is helpful to understand the objectives of the project owner and then tailor the technical studies to meet those objectives. This does not mean low balling costs to make the study a promotional tool. It means focusing on what is important. It means recognizing the path, and what doesn’t need to be engineered in detail at this time. This may save the client time, money, and improve credibility in the long run.
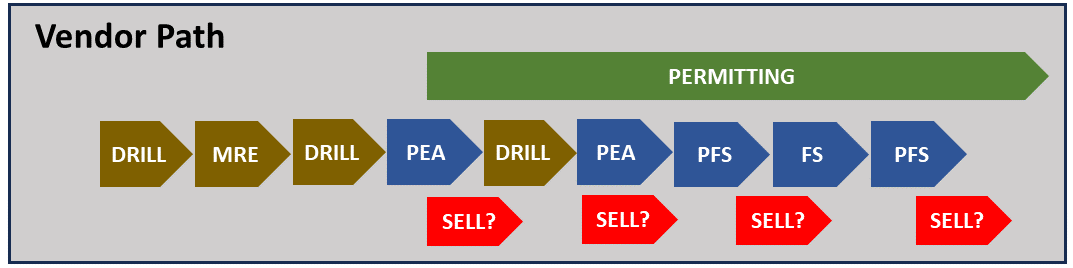
 This post is just a brief discussion of mining project timelines. For those interested, there a few additional project timelines for curiosity purposes. Each path is unique because no two mining projects are the same. You can find these examples at this link “
 NPV One is targeting to replace the typical Excel based cashflow model with an online cloud model. It reminds me of personal income tax software, where one simply inputs the income and expense information, and then the software takes over doing all the calculations and outputting the result.
 Pros
Pros Like anything, nothing is perfect and NPV may have a few issues for me.
 The NPV One software is an option for those wishing to standardize or simplify their financial modelling.

 I remember in the late fall of that year, the company had a chance to bid on a larger project in Gros Morne National Park, Newfoundland. So our President, Frank Nolan (he was a brother to Fred Nolan, the infamous land-owner at Oak Island, by the way), decided he wanted to see the site and he chartered a Bell 106 helicopter to fly us there from Deer Lake. It was December (they say “December month” in that province) and when we got close to the Park, we ran into a sudden snow squall.
 The QMM field office In Port Dauphin, Madagascar was located near the edge of town, and I typically walked from my lodging to the office each morning when I was there, about the time when school started for the children. Typically I passed dozens and dozens of tiny bamboo huts with corrugated metal roofs, and dirt floors each about 2 meters square.
 It is one thing to briefly visit a remote project as part of a review team. It is another thing to be there as part of a design team trying to solve a problem and engineer a solution. I know of many engineers and geologists that would have similar work life experiences as part of their careers. However John has taken the initiative to write it all down.