 Every few weeks we see another feasibility study completed. Normally the numbers will look fantastic. The feasibility study shows that a project could work, but will it really work?
A positive feasibility study is the moment a mining project is supposed to come alive. It’s the point where geology, engineering, and economics merge into a real (i.e. bankable) business case. However, it is also the starting point of an entirely different and more difficult path.
The roadblocks between a feasibility study and a producing mine can be numerous, varied, and often have nothing to do with the geology itself. A government can change the tax regime, or a community can withdraw support. The commodity prices can turn, or environmental permits can be challenged in court. A company’s own board can lose conviction. Understanding this development gauntlet is the difference between allocating capital to projects with returns and those that will consume capital for a decade.
 Stalled projects will experience several of the roadblocks simultaneously. A single roadblock might be surmountable, but multiple roadblocks may not be.
Many of these roadblocks will be identified during confidential third-party due diligence by potential partners, acquirers, or financiers. Hence investors may never learn the actual truth as to why the project is stalled and are left guessing why.
I have been part of due diligences on behalf of lenders and have seen the negative reasons never make it to the public eye. Sometimes the company may itself not know why a project was declined, although they can make an educated guess.
The following is a checklist of the various pitfalls leading to the study graveyard. Check off all those that you think apply to your favorite stalled project. Be honest. Typically, more than one will apply and they will tend to compound.
Geotechnical & Geological Risk
-
Review of the block modelling reveals concerns with grade, continuity, or metallurgical recovery.
-
Review of the expected geotechnical conditions reveals mining concerns associated with faulting, weak ground, karst, high water inflows.
-
Metallurgical complexity understated in feasibility (refractory ore, penalty elements).
-
Resource classification is suspect and a lot more infill drilling is required, at a high cost.
-
Hydrology issues, e.g. acid rock drainage severe and difficult to manage long term and becomes a corporate liability.
Technical & Engineering
-
Feasibility study found to be technically flawed upon review.
-
Project is very complex and will be difficult to build on budget and on time, as well as difficult to staff with qualified operating personnel.
-
Processing technology unproven at scale, ore sorting risk ,etc.
-
Infrastructure assumptions (power, water, road) prove more costly or difficult.
-
Mine plan optimistic on strip ratios, mining rates, or equipment productivity.
-
Tailings storage facility design issues, high risk, or siting problems.
-
Water rights access insufficient or contested.
-
Offsite infrastructure (road, rail, or port) inadequate and too costly to build.
-
Remoteness – labor costs and retention problems underestimated.
Permitting, Regulatory, and Social License
-
Environmental impact assessments likely to be rejected or endlessly delayed.
-
Perceived difficulties to get operating licenses, water licenses, or discharge permits.
-
Regulatory framework uncertain and changes mid-process (new environmental laws, mining codes).
-
Federal/state/provincial jurisdictions overlap creating jurisdictional gridlock.
-
Permits granted but successfully challenged in court by third parties.
-
Indigenous or First Nations consultation failures, failure to negotiate community benefit agreements acceptable to all parties.
-
Local community opposition leading to blockades or political pressure.
-
NGO campaigns attracting negative media attention that spooks investors or lenders.
-
Religious, cultural, or heritage site conflicts with site plan.
-
Mineral title disputes persist with overlapping claims or historical issues.
-
Land access agreements with surface rights owners difficult to acquire.
Political & Country Risks
-
Government instability, coup, or change of administration hostile to mining.
-
Retroactive tax increases, windfall profit taxes, or royalty rate changes.
-
Nationalization or forced renegotiation of mining agreements.
-
Corruption demands that the company is unwilling to meet.
-
Sanctions, war, or civil unrest making the region inaccessible.
Financing & Capital
-
Inability to secure project financing (debt or equity) due to financier risk appetite, commodity price outlook, or lender requirements.
-
Cost overruns discovered during reviews that make the economics unviable.
-
Declining commodity prices between feasibility and financing.
-
Owner balance sheet too weak to fund large construction; inability to attract a joint venture partner.
-
Royalty or streaming deals entered into that are too dilutive, making equity unattractive.
Corporate & Strategic
-
Management change leading to strategy pivot away from the project. The internal champion is gone.
-
Company acquired by a buyer with a different portfolio strategy — project shelved.
-
Board loses conviction or knows they cannot manage this; project deprioritized in favor of capital returns or other assets.
-
Key technical personnel depart, taking institutional knowledge with them.
-
High market cap of owner makes the acquisition cost high, when considering the capital cost to build must also be incurred by the acquiror. This will lower the return.
Market & Macro
-
Commodity price collapse, or forecasting an oversupply, makes the project sub-economic even with a positive study.
-
Input cost inflation (energy, steel, labor, reagents) erodes profit margins.
-
ESG-driven investor exclusions make it impossible to raise equity capital.
-
Offtake agreements cannot be secured on acceptable terms. This can be important in industrial and battery mineral projects. This may require focusing on downstream processing into upgraded specialty products, increasing risks and costs.
Conclusion
 The list of potential production roadblocks is extensive. Moving from the study stage to production is very difficult and very few can do it successfully. A positive feasibility study is a necessary but far from sufficient condition for production.
When projects stall, it is likely due to multiple factors listed above. A ranking analysis may conclude the compounding effects of the perceived risks makes the project a no-go for financiers.
Some people will say be thankful that more projects don’t advance to production, because we would likely see more failures as the risks come to bear Ideally only the best projects are moving forward, but even there we can see mixed results.
Due to the upcoming shortages of < insert critical mineral > we need more exploration and more discoveries. Given the number of idle feasibility stage projects now, who is to say that these new discoveries won’t see the same roadblocks that the current projects are seeing. Real mining is a tough business – doing studies isn’t.

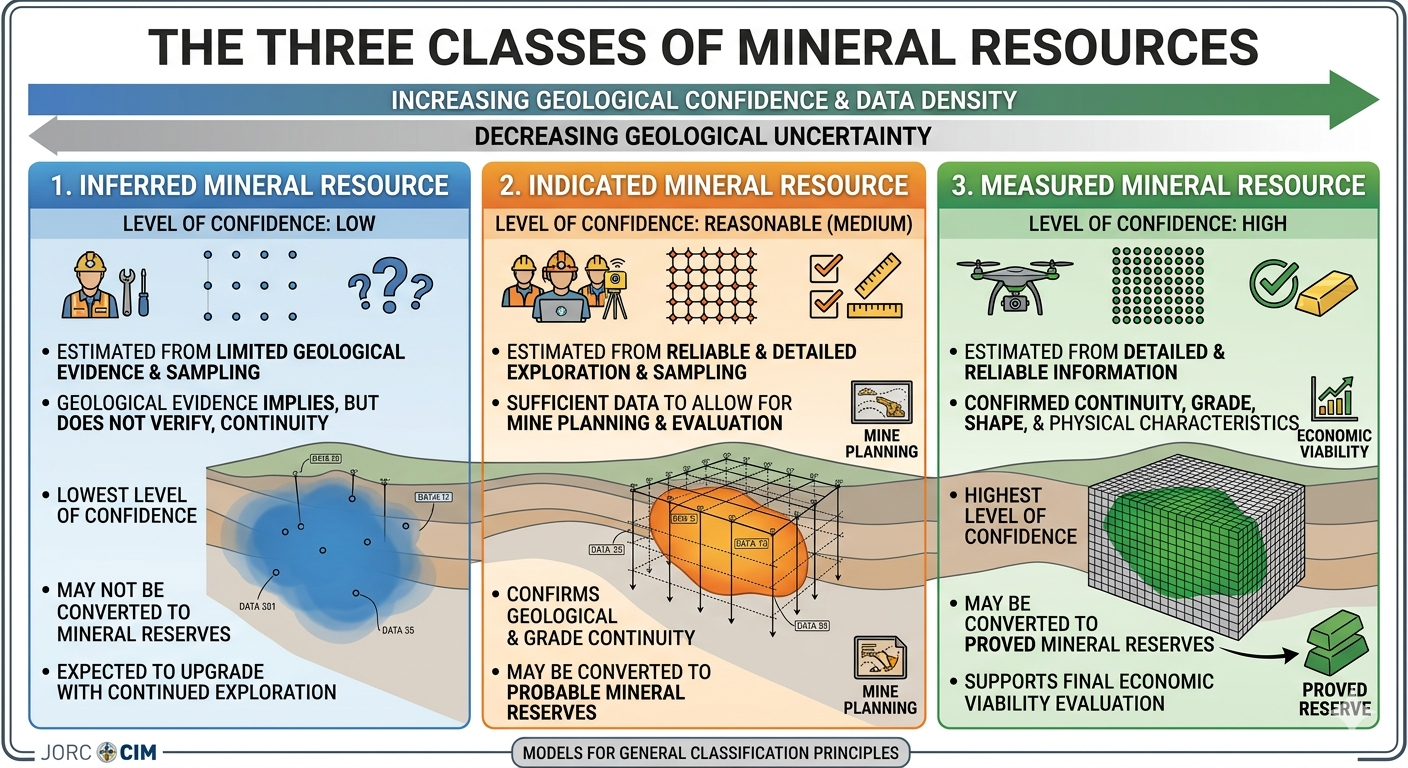 Inferred resources represent the lowest confidence category of mineral resources; typically estimated in zones with limited sampling and unconfirmed geological continuity. They carry the highest geological uncertainty of the three resource categories.
 Companies sometimes will commence the permitting process based on their PEA study. There are some risks to doing this, and the Inferred resource creates one of these risks.
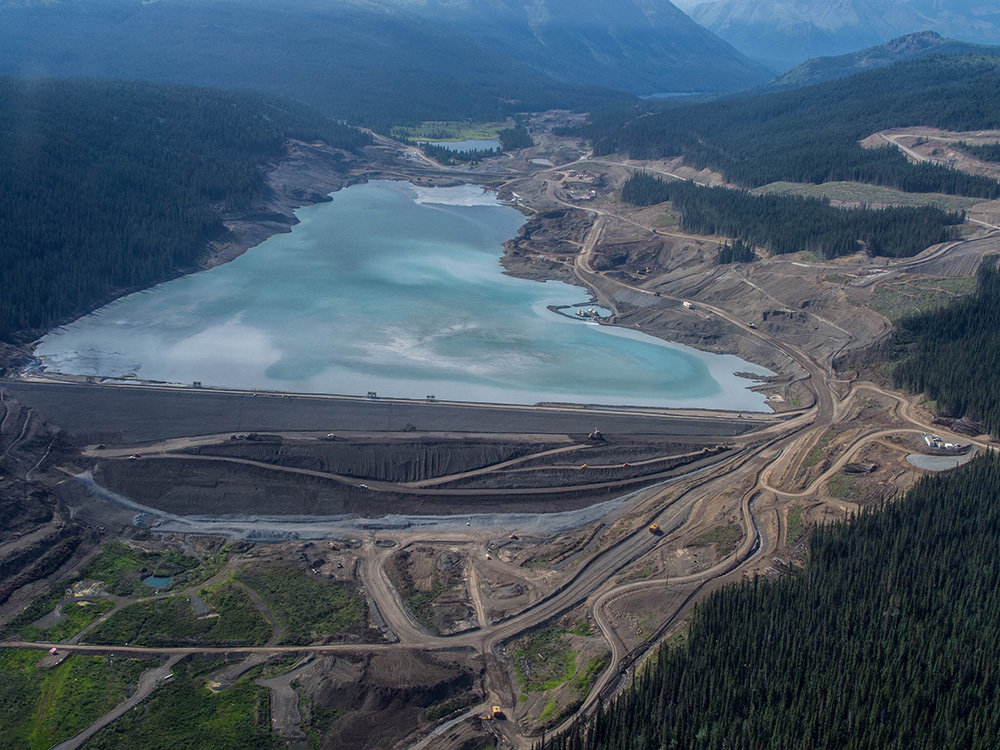 Let us examine some specific aspects of permitting that can be influenced by Inferred resources.
 Inferred resources present a unique paradox; they can and can’t be used in mining economic analysis. They can be used to examine project viability but can’t be used to make a production decision.
 Is the concept of optimization the most important factor in a project’s design? If so, which aspect is the most important to optimize? A danger is optimizing for a single criteria, for example NPV, at the expense of everything else. Selecting the optimal design for one aspect will likely result in being sub-optimal in some of the others.
 Optimization of a mining project can yield meaningful cost and efficiency gains. However mines face inherent constraints, such as ore grade variability, geological surprises, equipment life cycles, and regulatory issues.
 If one decides to pursue the path of operational flexibility, what are the things that help make it happen?
 Rather than focus on constant optimization in design, it may be wiser to focus on a flexible design. Adaptability, flexibility, and resilience may be more important than being fully optimized.
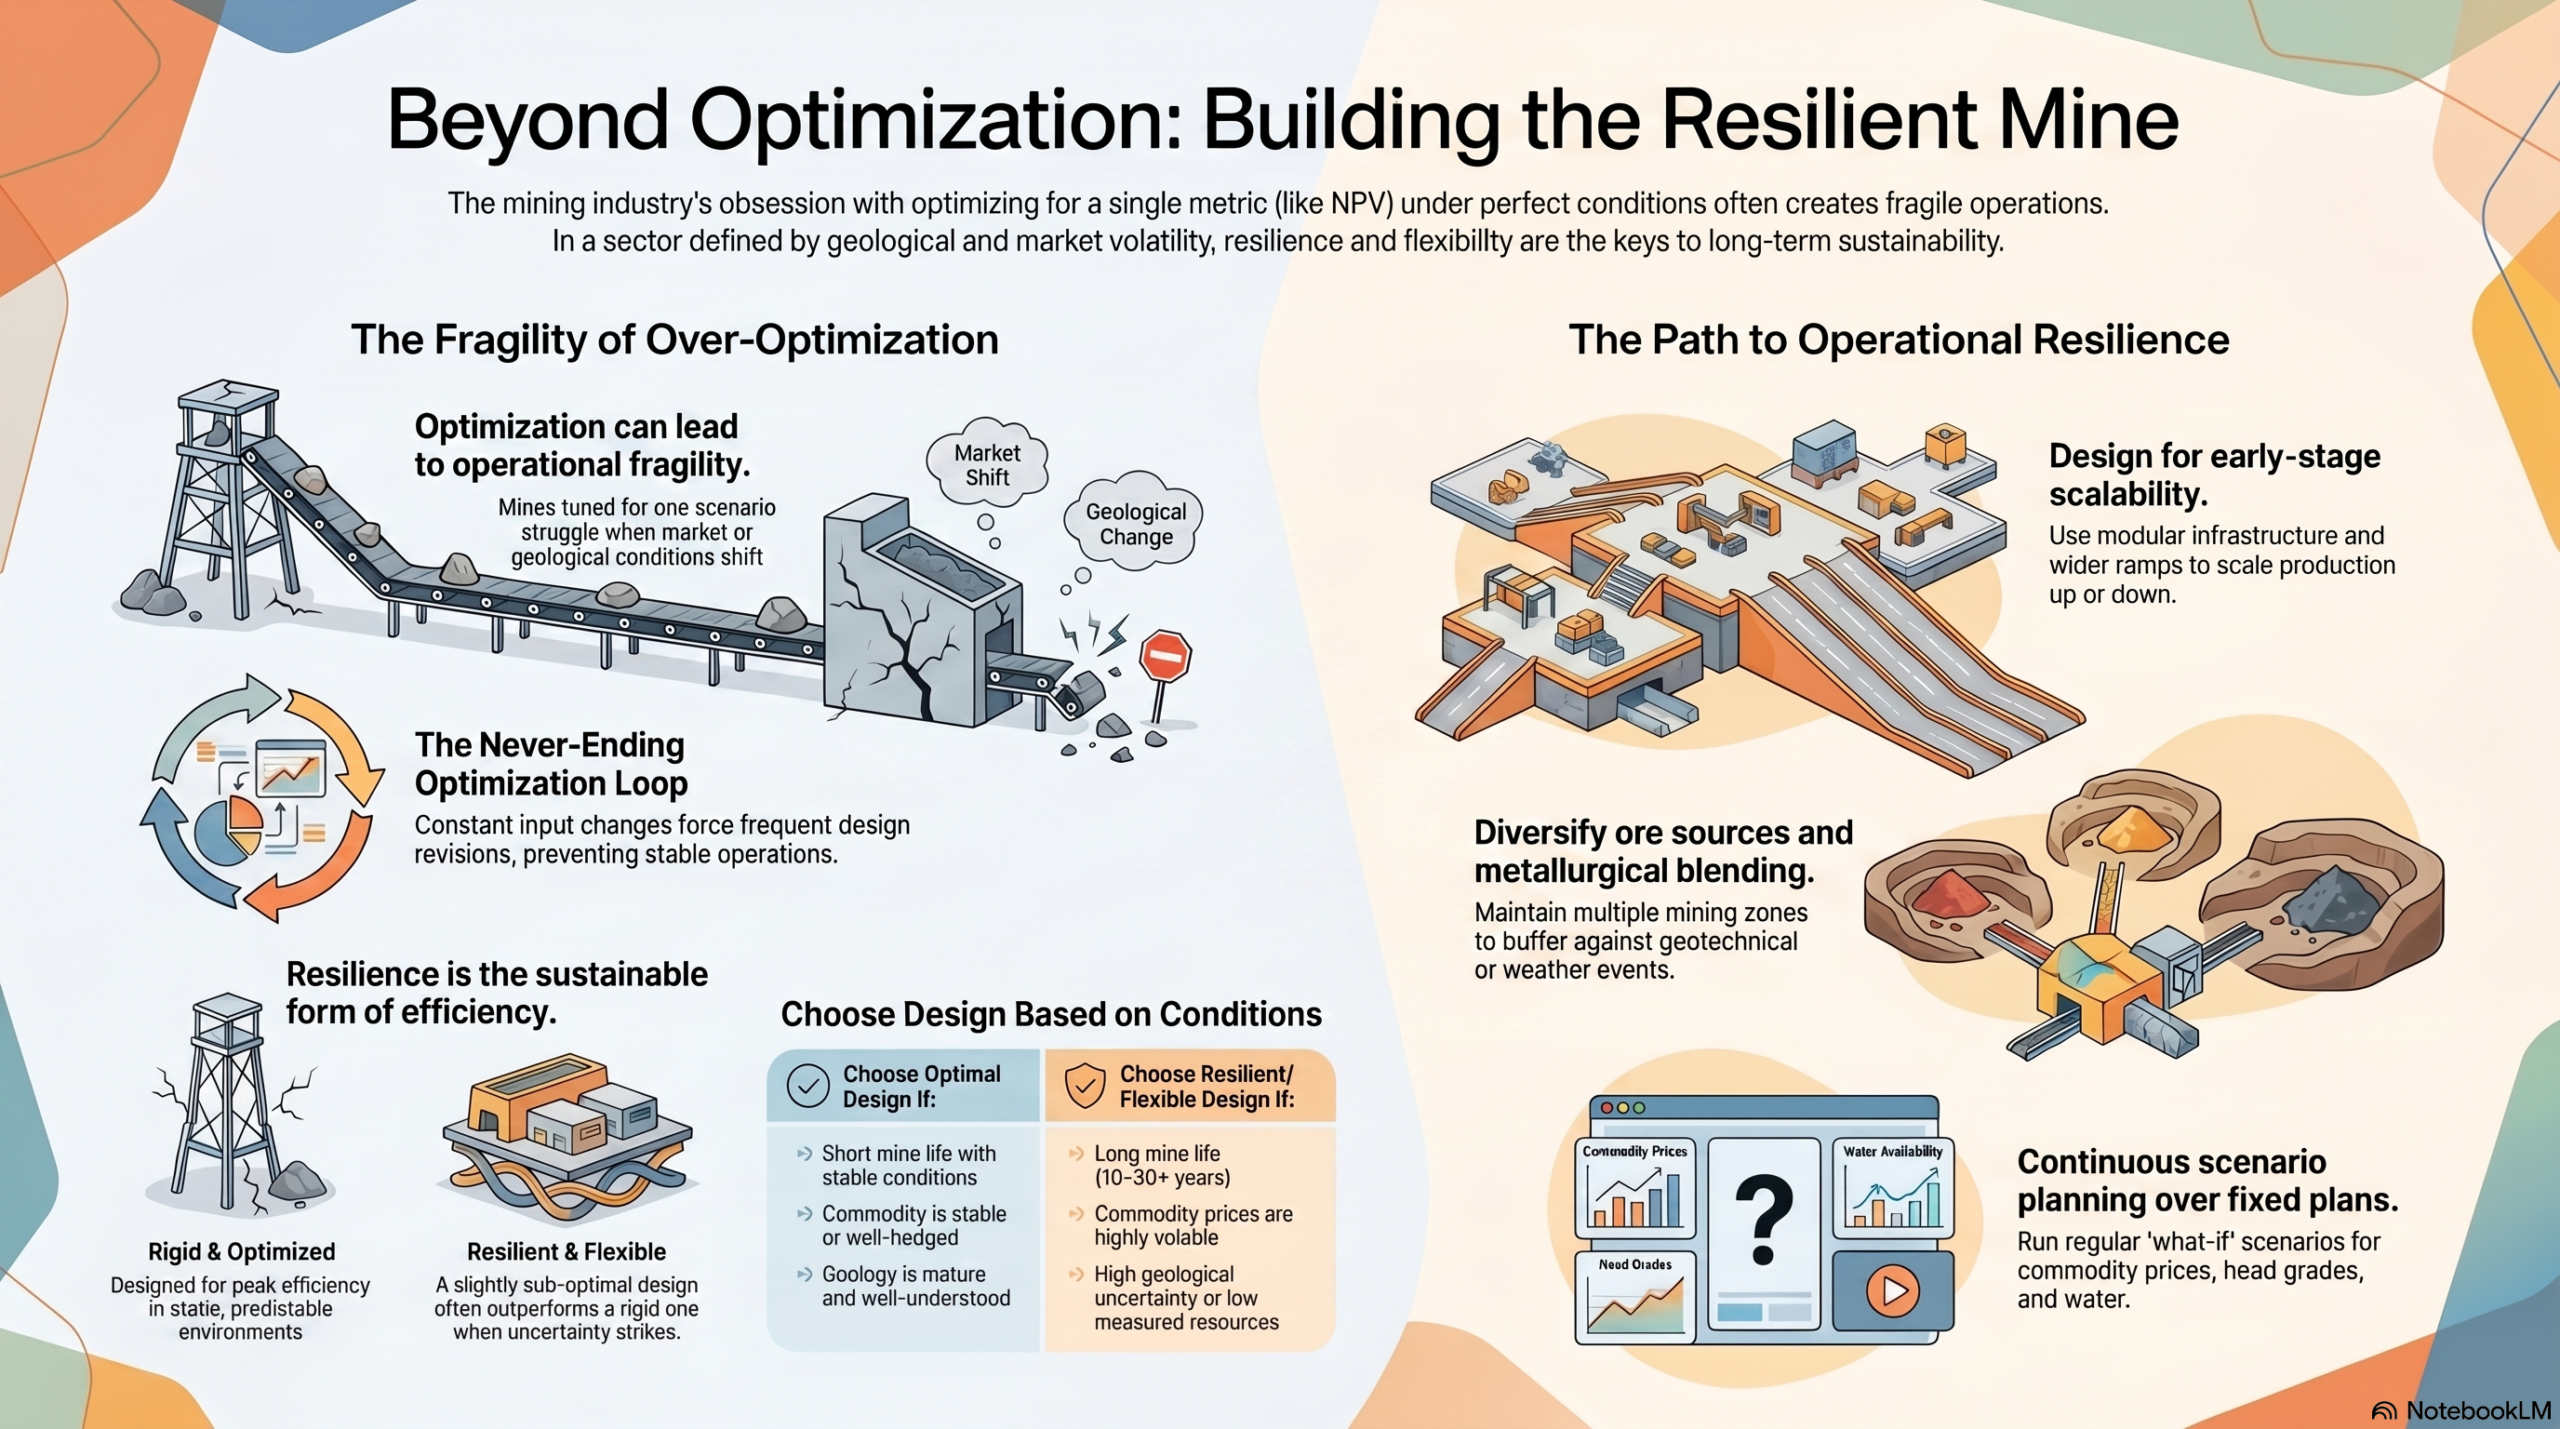
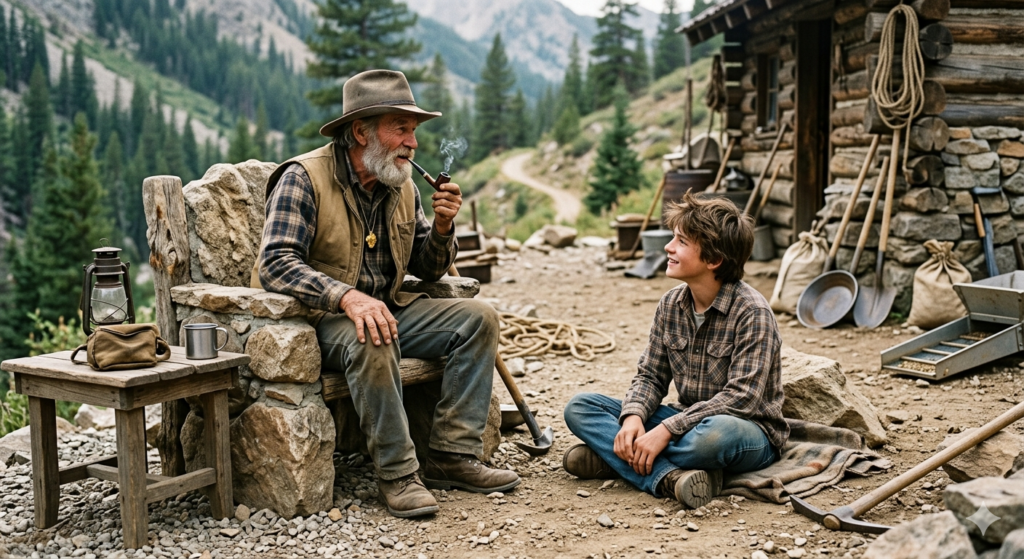 Junior mining companies and Tech Startups share numerous similarities, although they operate in very different worlds. The following comments should recognize that junior mining ecosystem has been around for generations, long before the birth of tech ecosystems.
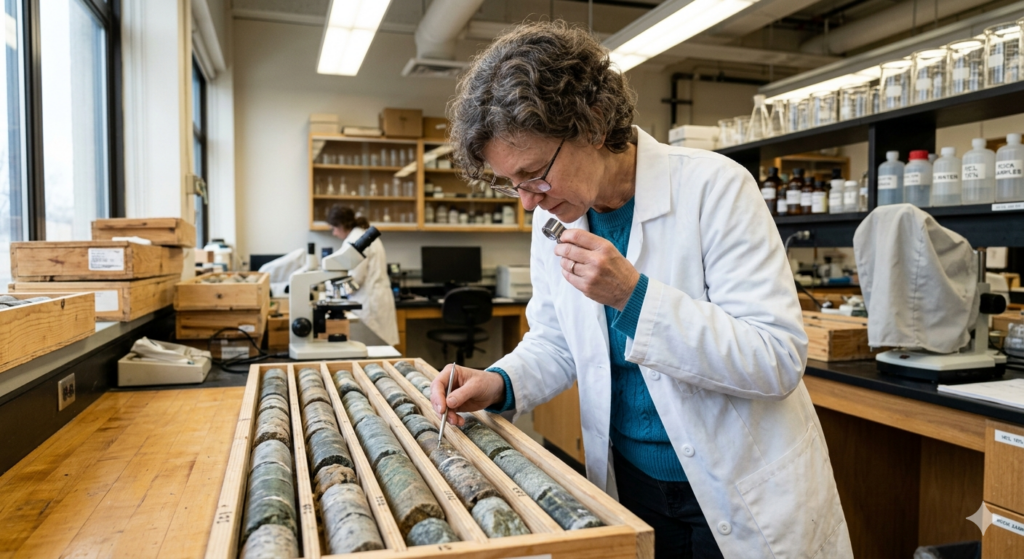 Exploration spending shares some of the same characteristics of more commonly R&D.
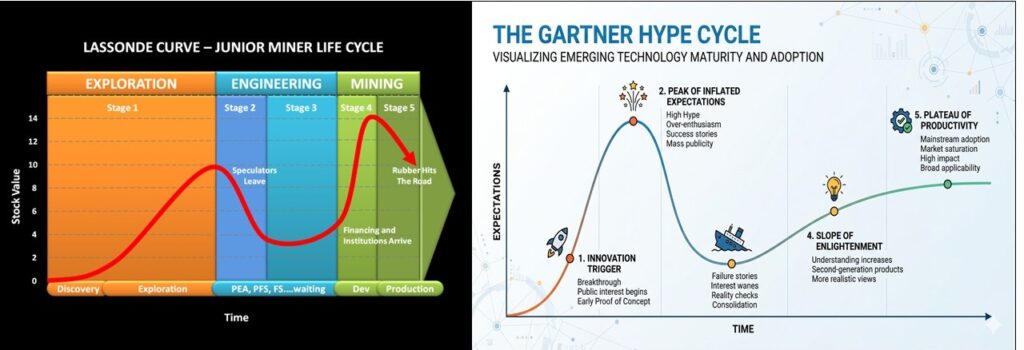
 Another similarity between junior mining and tech world is in the way early-stage viability is assessed. This is required to decide whether millions of dollars of further investment is warranted. Miners will complete a PEA. Startups will complete Product-Market Fit research.
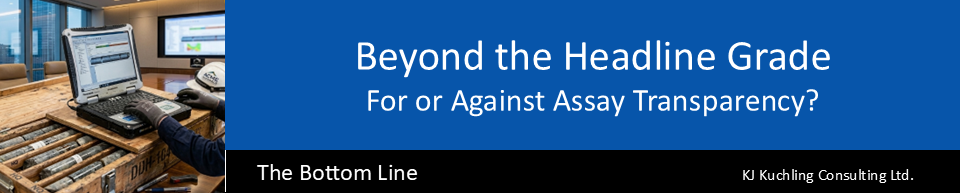
 Recently I have been reviewing a few mining projects from an investor’s perspective. This led me to wonder whether junior mining companies should share more than just their drill hole highlights. What about the raw assays? A mining company announces highlighted drill intervals, but what exactly do those numbers represent?
 There is a sense that many mining investors are becoming more sophisticated, and they want to fully understand the exploration process.
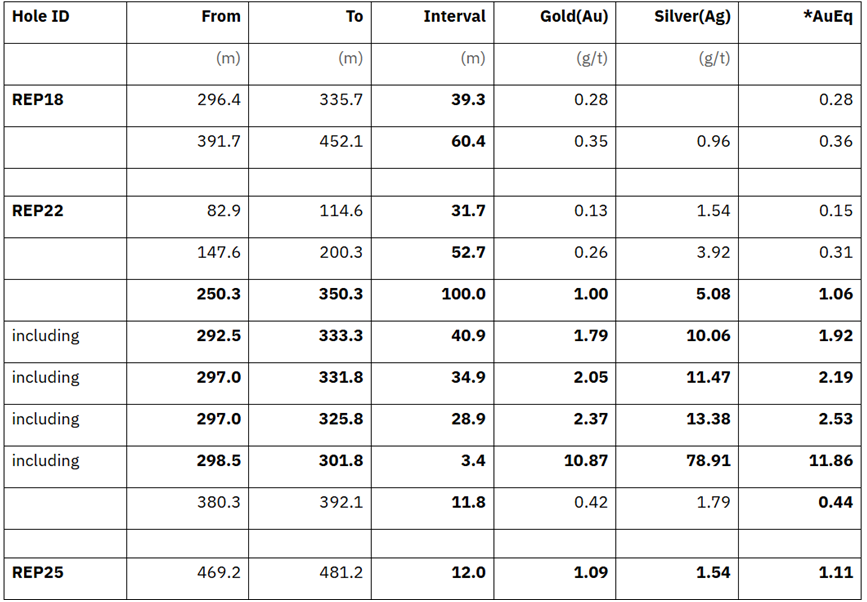
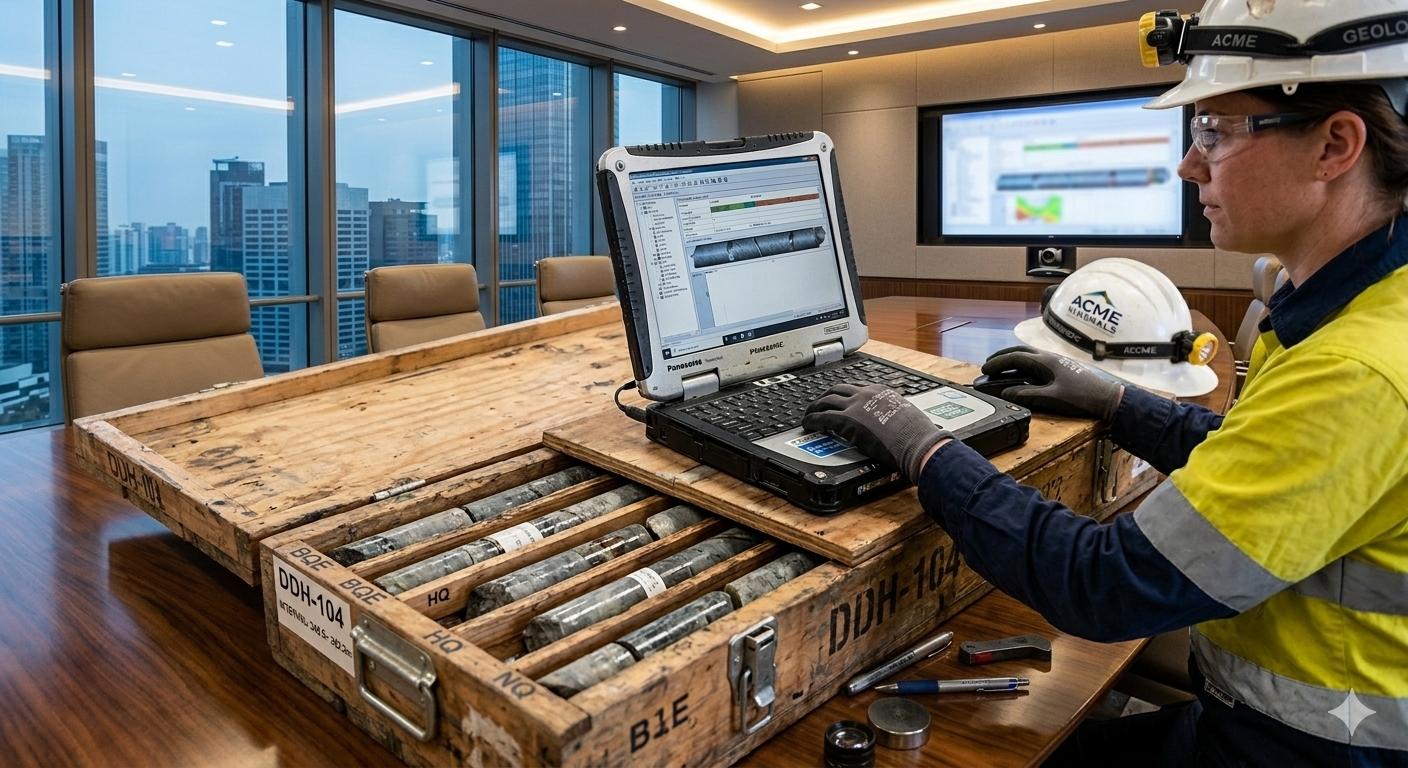
 1. Misinterpretation & “Amateur” Experts: One risk is that someone with a very basic understanding of mining software and limited understanding of the local geology, runs flawed interpretations and publicizes their incorrect conclusions. A company may find that correcting false narratives publicly can be harder than preventing them.
 Once the assay data is public, it may be more difficult for a company to manage the story. A press release lets them frame results in the context of their business plan; a raw data file does not.
 For investors trying to assess a junior explorer, or geologists conducting a technical review, or a regulator trying to ensure fair and accurate disclosure, access to raw assay data can play a part in promoting good judgment and accurate disclosure from companies.
 I recently noticed a few new mining studies that relied on toll milling as their base case operation. This made me wonder if this is a trend and if there are more examples of where this is happening.
 USER PROMPT: What are the risks of toll milling plan.
 RESPONSE: The Qualified Person (QP) signing off on a technical study that uses toll milling as the base case carries significant professional and regulatory responsibility, particularly under NI 43-101 in Canada or JORC in Australia.
 The results given by Claude are quite thorough and insightful. It’s hard to argue with its observations and conclusions. This research took all of 30 seconds, so I can see it is no longer difficult to become a blog writer. Writing isn’t the challenge; finding interesting topics is.
 In my view, having a single industry platform for critical infrastructure risk management provides several benefits. These are:
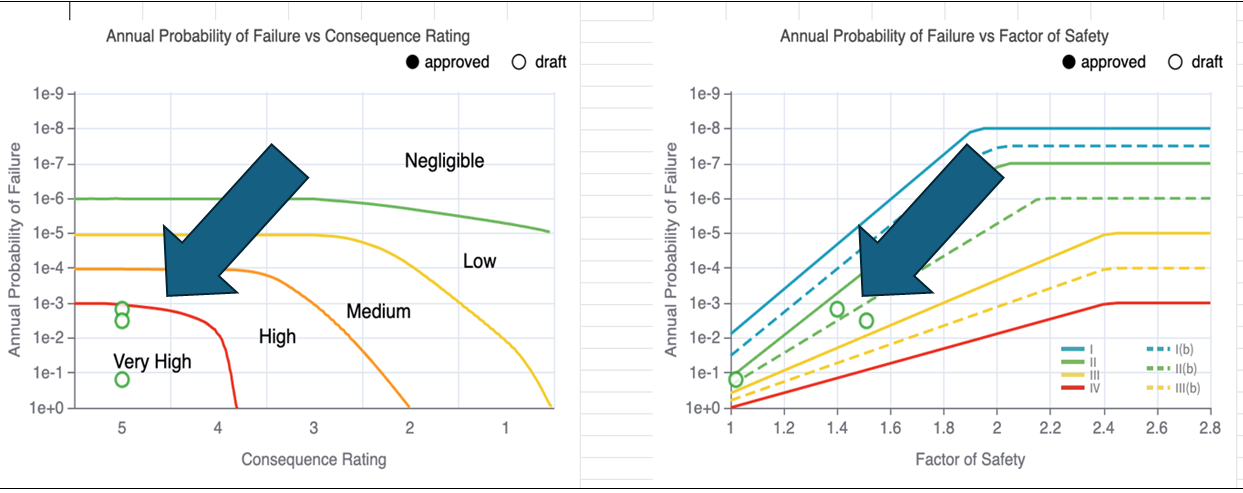 Each mine site is unique with its own set of “Facilities”. For example, the individual Facilities could include Tailing Management Area #1, TMA #2, the Heap Leach Pad, Waste Dump #1, Waste Dump #2, etc.
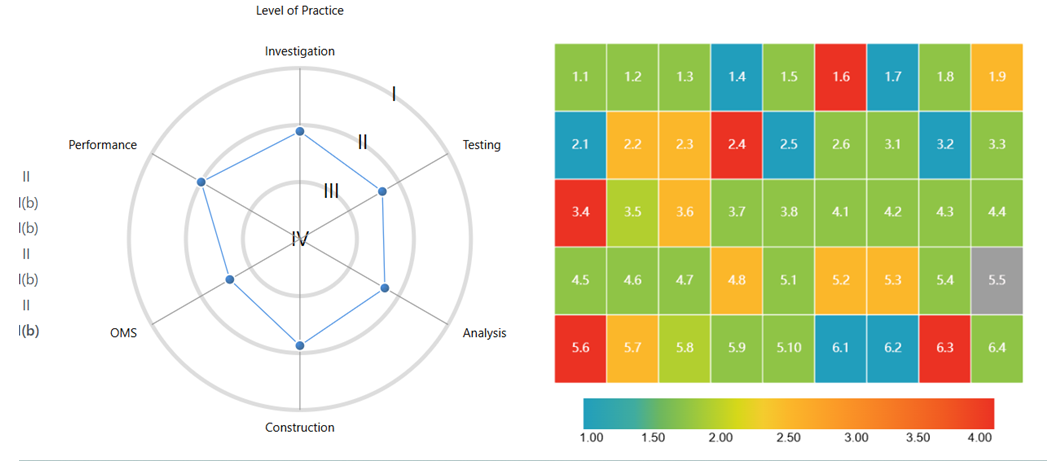
 The Level of Practice (LOP) is a measure of the integrity and quality of data used to design and manage a mine facility. The CI-RiskDB platform currently uses 45 criteria to evaluate the LOP associated with a facility. For example, these quality criteria include items such as: current understanding of soil profile; testing & verification between lab and field investigations; stability analysis detail; construction QA/QC undertaken, monitoring programs, etc.
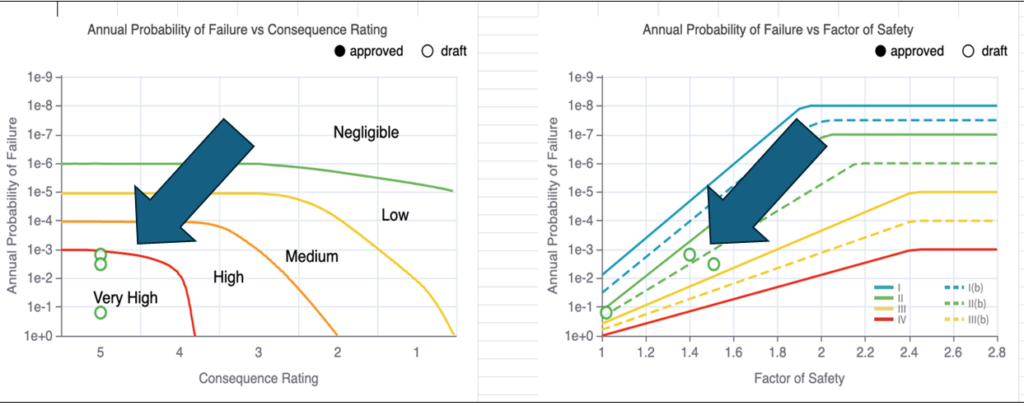
 Over confidence of personnel is something that can unfortunately play a role in risk management. However, the more eyes involved with reviews and signoffs, as well as occasional third party audits, the less likely that this occurs (hopefully).
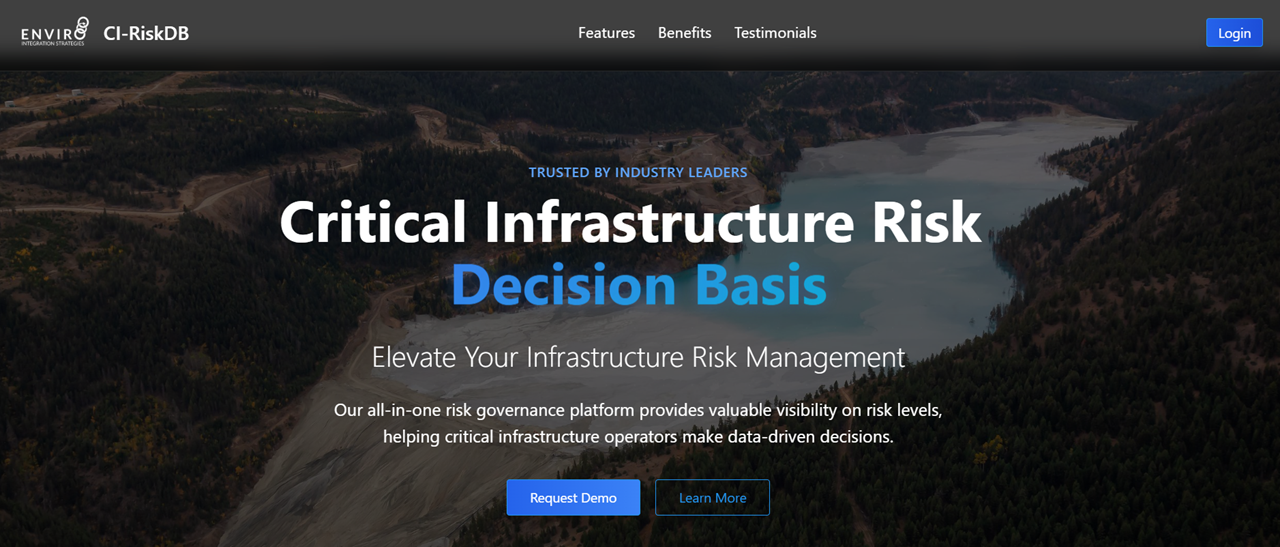
 In closing, as of this month December 2025, I understand the Critical Infrastructure Risk Decision Basis platform is currently being piloted and implemented at a number of mine sites in Canada, including Agnico Eagle at a corporate level. Additional pilots may be forthcoming in 2026.
 Syncrude had four large walking draglines, each with a 80 cubic metre bucket and 110 metre operating radius. These were very big machines; you could sit one in the end zone of a football field and the bucket would be digging (or dumping) in the other end zone. Two draglines were on the East side of the mine and two were on the West, mining the oilsand in 25 m wide strips.
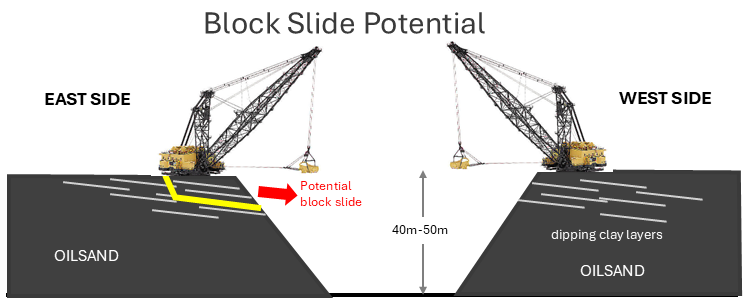 There were numerous instances of East mine block slides, where large portions of the upper slope would fail as large blocks, 50 metres long and up to 30 metres back from the crest. The fear was that if a dragline happened to be sitting on one of these failing blocks, the entire machine would slide along into the pit. Many block slides did occur over the years, but only a few came close to jeopardizing a machine. The geotechnical monitoring programs in place were successful (described later).
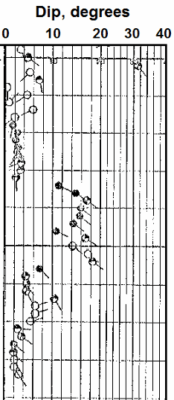 The insitu clay structures were identified using oil and gas borehole logging technology, with tadpole dipmeter plots (see image) used to analyse the bedding (the tail on the tadpole shows the dip direction). The vertical axis is depth from surface or elevation. The geotech engineers would use this information, combined with structural mapping of previously mined faces, to forecast potentially unstable areas.
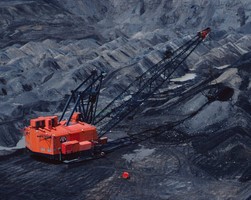
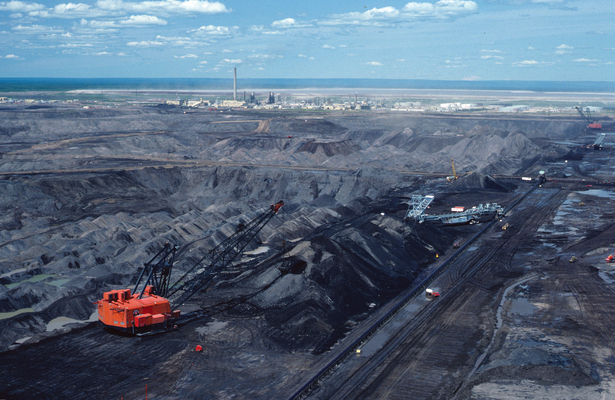
 The main geotechnical issue on the West side were basal slope failures, termed this due to sliding along weak clays and muds at the base of the highwall. This photo shows a typical basal failure. Basal failures also occured on the East side.
 Once our engineer-in-training rotation program was complete, we were to be assigned to a more permanent position. For me, that was going to be as an East side geotechnical engineer – ugh!. It’s at that time I decided to look for greener pastures. Three years was long enough from 1980 to 1983; given the amount of learning and responsibility I had undertaken. Other colleagues left the same time, while many other friends stayed in Ft McMurray for their entire careers.
 In Part 1 of this two part blog post I would like to share some stories from the early days of my career working in Fort McMurray.
 At the time Syncrude had an excellent engineer-in-training program for new graduates. Every six months they would rotate engineers into different technical areas.
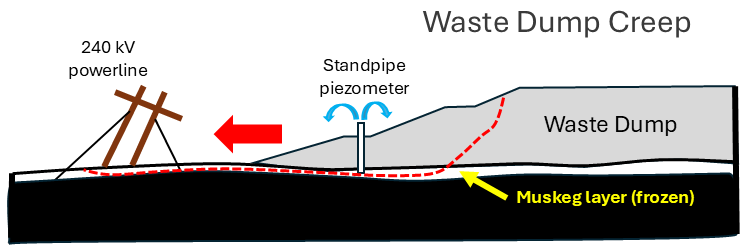 Next we sampled that depth carefully, revealing that frozen muskeg layers were present. When we installed standpipe piezometers in these holes, we saw water flowing out of the top of the pipes. This means the foundation pore pressure is high, way too high.
 For example, one project I had was to monitor the performance of different brands and styles of conveyor idlers. We would track about 2,000 individual idlers; when they were installed on the conveyors; when they were removed, why they were removed (bearing failure, cover failure, something else).
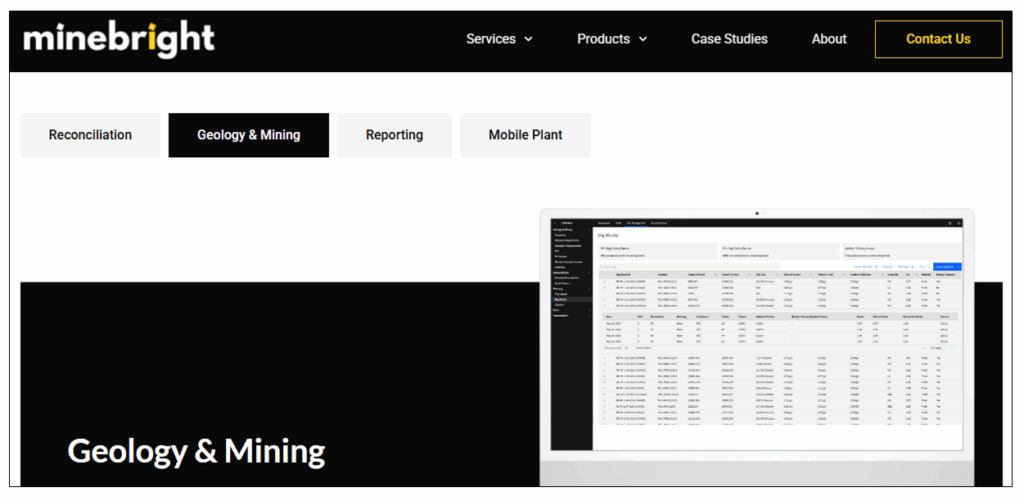
 The mining industry is implementing more and more technology in the mining cycle.
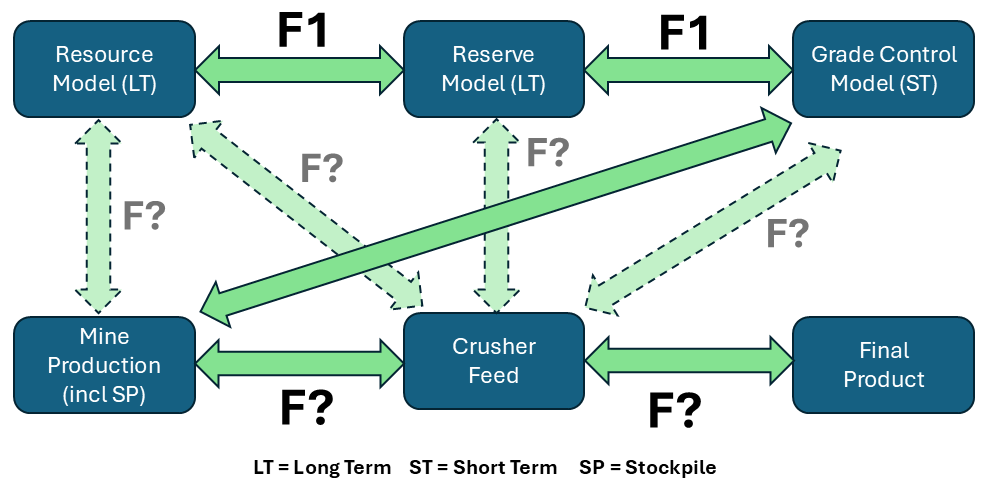 Mine reconciliation requires information such as initial predictions from exploration data and geological models, actual measurement: data from mining sources, such as blast holes, stockpile samples, or mill feed. As well it will need data on the final product being shipped off site. Do the metal quantities balance out throughout the mining operation?
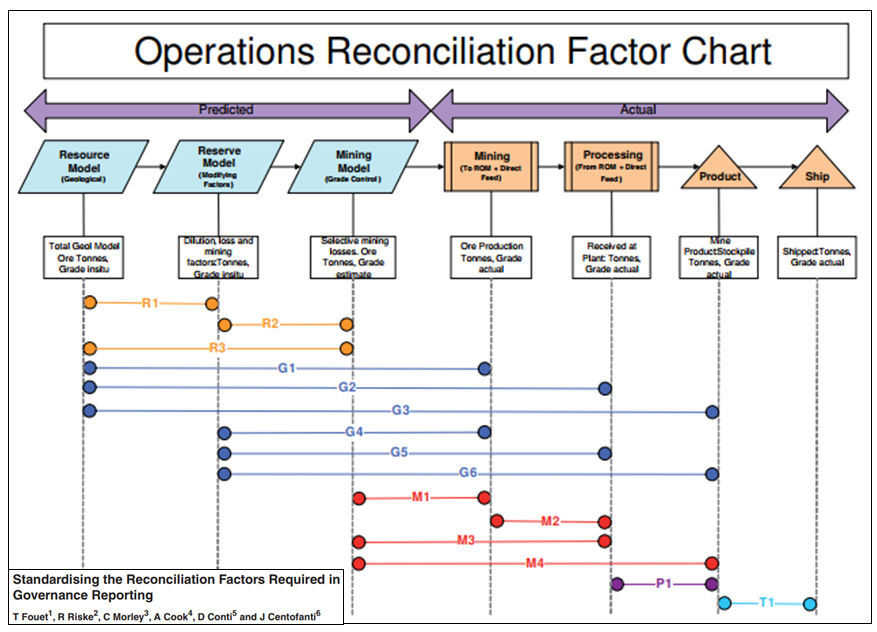
 Each mine site may be unique with respect to; ore sources; terminology; ore types; mining methods; stockpiling philosophy; processing methods; technology availability; and personnel capability. So often the easiest approach for mine reconciliation is based on the Excel spreadsheet. (Reconciliation is generally not an easy undertaking).