


 How long does it take to turn a mineral discovery into a producing mine. Also how long does permitting really take? These are questions that I see asked frequently in mining circles. The answer often thrown around is “18 years.” Is that really true or is it just a much-repeated industry myth?
Answering these questions is one reason we created a new online App called Timeline Viewer, hosted on the Drilling Down website (https://sites.google.com/view/drillingdown).
What Is the Timeline Viewer
The Timeline Viewer is a online application where anyone can take a look at the milestone history of selected mining projects. Key milestones are laid out chronologically from initial exploration, through studies, permitting, and sometimes even up to production.
The Viewer puts it all in one place: a visual, browsable record of what happened and when. This information is derived from corporate press releases, and weblinks are provided.
This App was vibe coded using the Zite platform (https://www.zite.com/). Just explain to the AI what you want to create, and it then writes all the code for you. Very simple to use and fast.
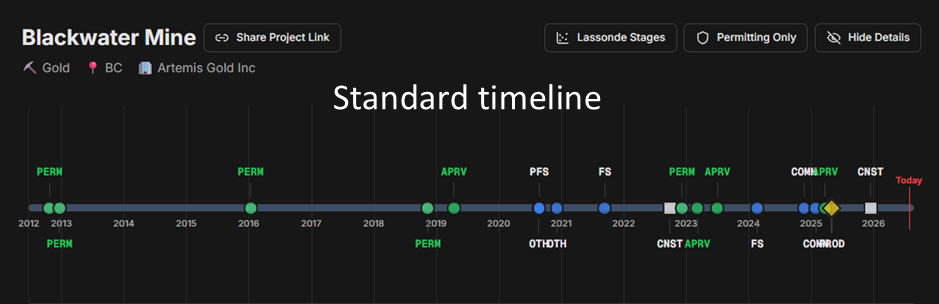
Let’s look at some Viewer output. The example below is the standard timeline view for the Brucejack Project in BC. One can see the sequence of activities that occurred over time as the mine moved into production. A details table (not shown) provides a brief description of each event. Hover over a point to see the details.
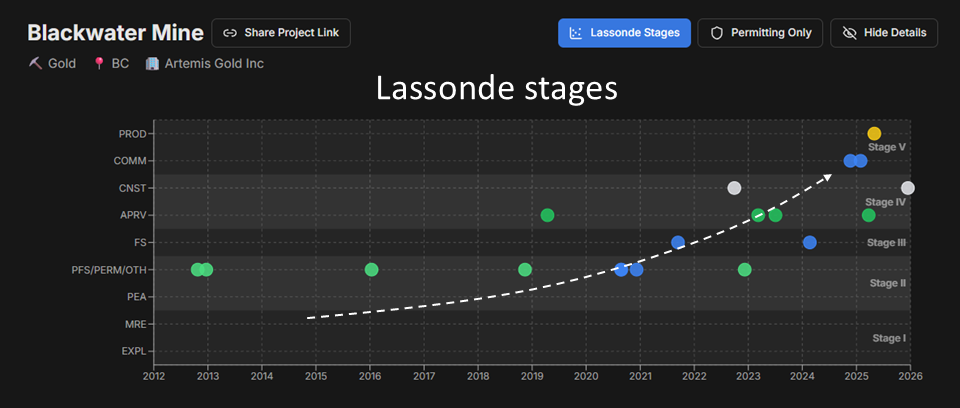
 An alternate way to examine the same timeline is to view the development progress in stages. In the Viewer app, we loosely use the term the “Lassonde Stages”, related to the Lassonde Curve (for more info). The Timeline Viewer lets you toggle on a view of the stages over time. Is it advancing towards production or flat lining at the same Stage.
For example, the image below shows the same Brucejack project with the Stages on the right side and milestones on the left axis. One can see the rapid rise as the project accelerates from exploration & studies (Stage II) to construction, commissioning, and production (Stage V). For comparison, the next image after Brucejack is the chart for the KSM Project. Do you notice any difference in the profile of the Stages?
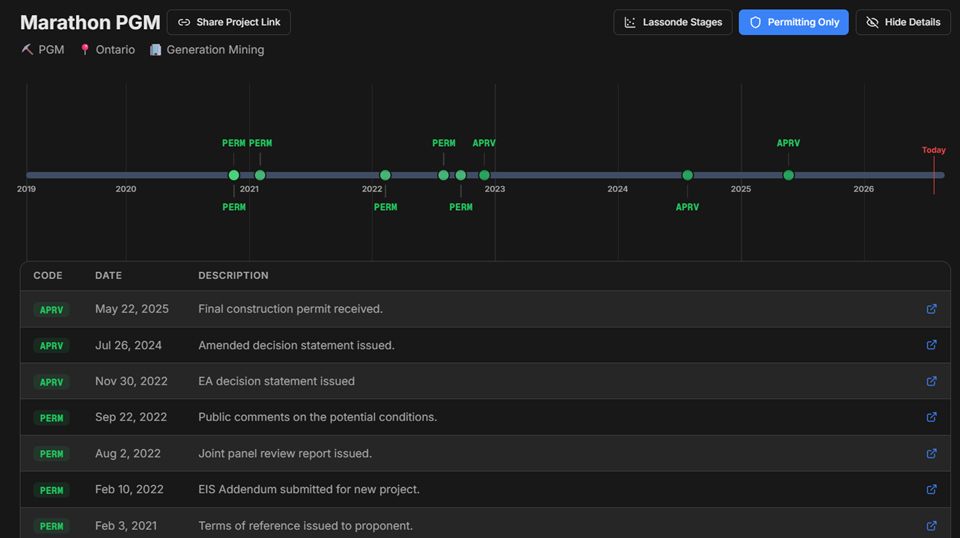
 The Viewer also allows one to see only the “permitting” events to focus on those. When was permitting initiated and when were approvals received? As an example, the timeline below is for the Generation Mining Marathon project, permitting activities only. They started the process in 2021 and received their federal final permit in 2025. The ball is in their court now.
Getting Started: The List of Projects
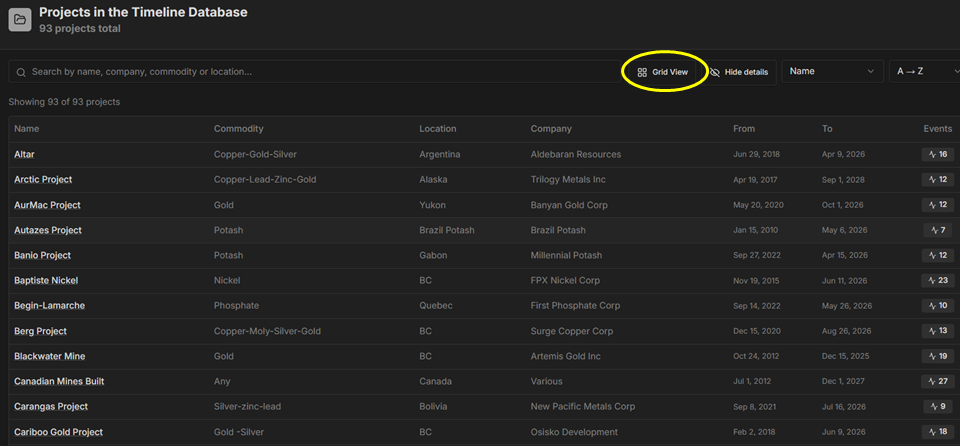
Before diving into an individual timelines, the obvious starting point is the List of Projects (https://jcrkyl7eju.zite.so/). This list gives you an overview of every project currently logged in the database (over 90 as of today).
You can browse the list in either Grid view or List view. Once you find a project of interest, clicking on it takes you to its timeline in the Viewer.
In the Viewer, (https://sites.google.com/view/drillingdown/timeline-viewer) you can trace the entire arc of a project’s development: when exploration drilling began, when a resource estimate was published, when studies (Preliminary Economic Assessment, Prefeasibility, Feasibility) were completed, when permits were approved, and when construction and commissioning eventually led to production. It’s a straightforward way to answer that “18 years” question for yourself, project by project.
Every milestone is categorized. The available categories cover the full lifecycle of a mining project: Exploration, Mineral Resource Estimate, Preliminary Economic Assessment, Prefeasibility Study, Feasibility Study, Permitting Activity, Permit Approval, Construction Start, Commissioning, Production, and a catch-all “Other” category for things like metallurgical testing, mergers, or partnerships that don’t fit neatly into the technical stages but are still significant to a project’s storyline.
All of the companies currently in the database (as of July 2026) are TSX listed. Many of their projects are in Canada, since government websites provide additional permitting timeline information as a backup. I noticed that some companies are much better at disclosing permitting steps than others. Its not often that I saw a company announce when public meetings were being held or when the public review period starts. I wonder why.
Why The Timeline Matters
For anyone following the mining sector, whether as an investor – analyst – geologist -engineer, the value of the Timeline Viewer is that it simplifies a series of press releases into a visual record.
You can look at different projects and start to notice patterns: which companies moved efficiently through permitting, which projects stalled for years at the exploration or pre-feasibility stage, and which ones sailed from discovery to production. Are there lifestyle companies out there in no hurry to get anywhere?
The Viewer is a tool for answering the “how long does it really take” question with actual information.
The Companion Piece: The Timeline Editor
The Timeline Viewer database is fed by a companion tool called the Timeline Editor, which is what allows the database to keep growing and stay current. The Editor is where the content gets compiled and maintained
If you’ve been following a specific project that isn’t in the database yet, you can add it yourself. Just send a message to KJKLTD@gmail.com to get access to the Editor. There is even a blank template available in Excel CSV format, so you can organize the project milestones on your own time and then upload them in the Editor.
One important thing to understand about this system is that it’s intended to be open source. Anyone who is given Editor access can modify a project’s timeline, which means there’s no absolute guarantee of accuracy on every entry. The information should be treated as crowdsourced rather than officially verified. Do not make investment decisions based on what you see here – this is for entertainment purposes only.
If you encounter a bug, issue or inaccuracy, please flag it by email (KJKLTD@gmail.com). We’re open to hearing comments, since nobody expects AI-written code to be 100% perfect.
Conclusion
 The Timeline Viewer is a simple tool for seeing how mining projects actually move (or don’t move) from discovery through to production. Over time as more projects get logged, the database becomes a richer resource for answering that original question honestly: does it really take 18 years to build a mine or how long does it take to permit? With enough timelines in the database, you can decide for yourself.
Note: You can sign up for the KJK mailing list to get notified when new blogs are posted. Follow me on Twitter at @KJKLtd for updates and other mining posts. The entire blog post library can be found at https://kuchling.com/library/
For some free mining calculator apps, including project timelines and a simplified cashflow modeller, check out this website https://sites.google.com/view/drillingdown
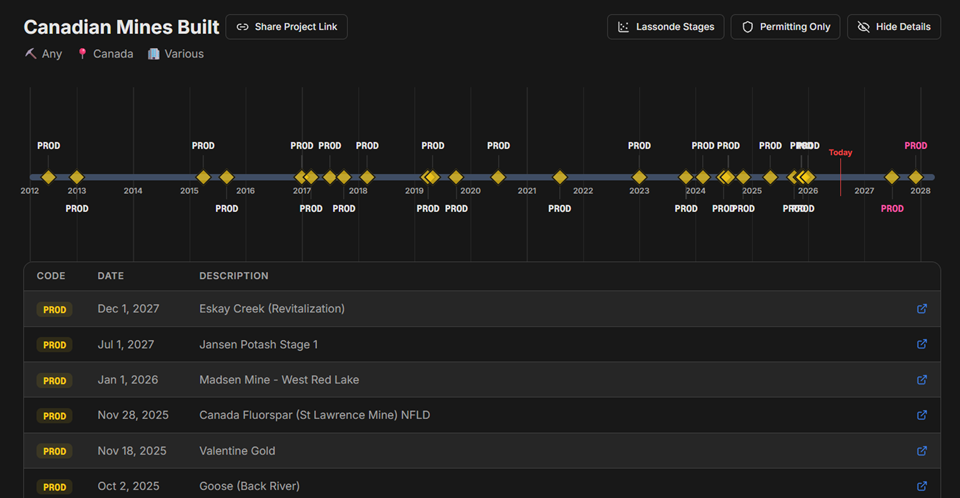
In closing, here is a summary timeline of all the mines coming into production in Canada over the last decade (from what I could find). The link to the timeline is https://neeovjtd7t.zite.so/project/3cd8bd8a-148f-4bc9-9bc3-fa56617f12d8

 Every few weeks we see another feasibility study completed. Normally the numbers will look fantastic. The feasibility study shows that a project could work, but will it really work?
 Stalled projects will experience several of the roadblocks simultaneously. A single roadblock might be surmountable, but multiple roadblocks may not be.
 The list of potential production roadblocks is extensive. Moving from the study stage to production is very difficult and very few can do it successfully. A positive feasibility study is a necessary but far from sufficient condition for production.
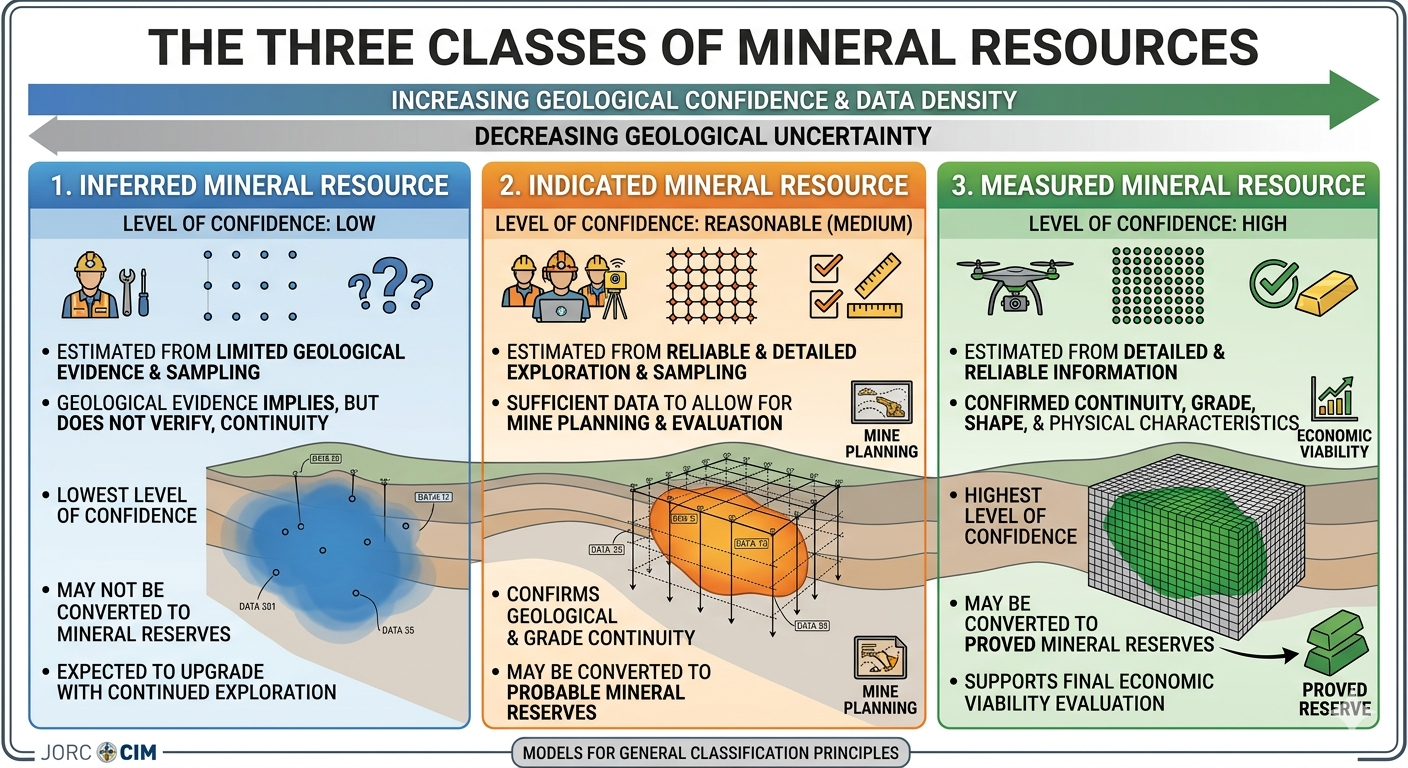 Inferred resources represent the lowest confidence category of mineral resources; typically estimated in zones with limited sampling and unconfirmed geological continuity. They carry the highest geological uncertainty of the three resource categories.
 Companies sometimes will commence the permitting process based on their PEA study. There are some risks to doing this, and the Inferred resource creates one of these risks.
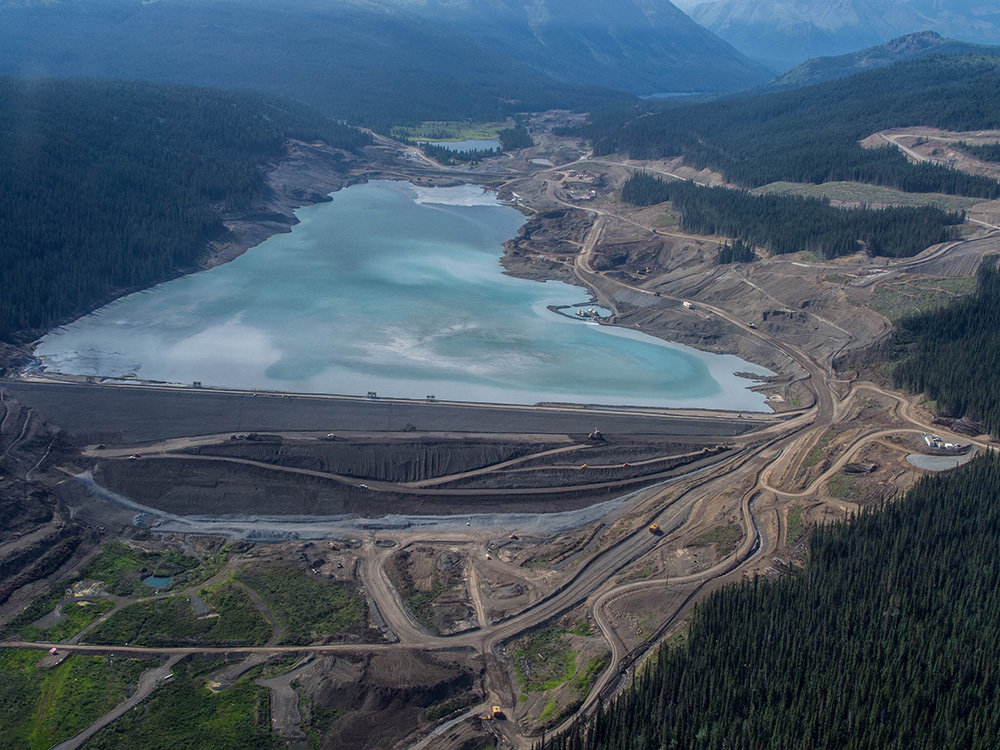 Let us examine some specific aspects of permitting that can be influenced by Inferred resources.
 Inferred resources present a unique paradox; they can and can’t be used in mining economic analysis. They can be used to examine project viability but can’t be used to make a production decision.
 Is the concept of optimization the most important factor in a project’s design? If so, which aspect is the most important to optimize? A danger is optimizing for a single criteria, for example NPV, at the expense of everything else. Selecting the optimal design for one aspect will likely result in being sub-optimal in some of the others.
 Optimization of a mining project can yield meaningful cost and efficiency gains. However mines face inherent constraints, such as ore grade variability, geological surprises, equipment life cycles, and regulatory issues.
 If one decides to pursue the path of operational flexibility, what are the things that help make it happen?
 Rather than focus on constant optimization in design, it may be wiser to focus on a flexible design. Adaptability, flexibility, and resilience may be more important than being fully optimized.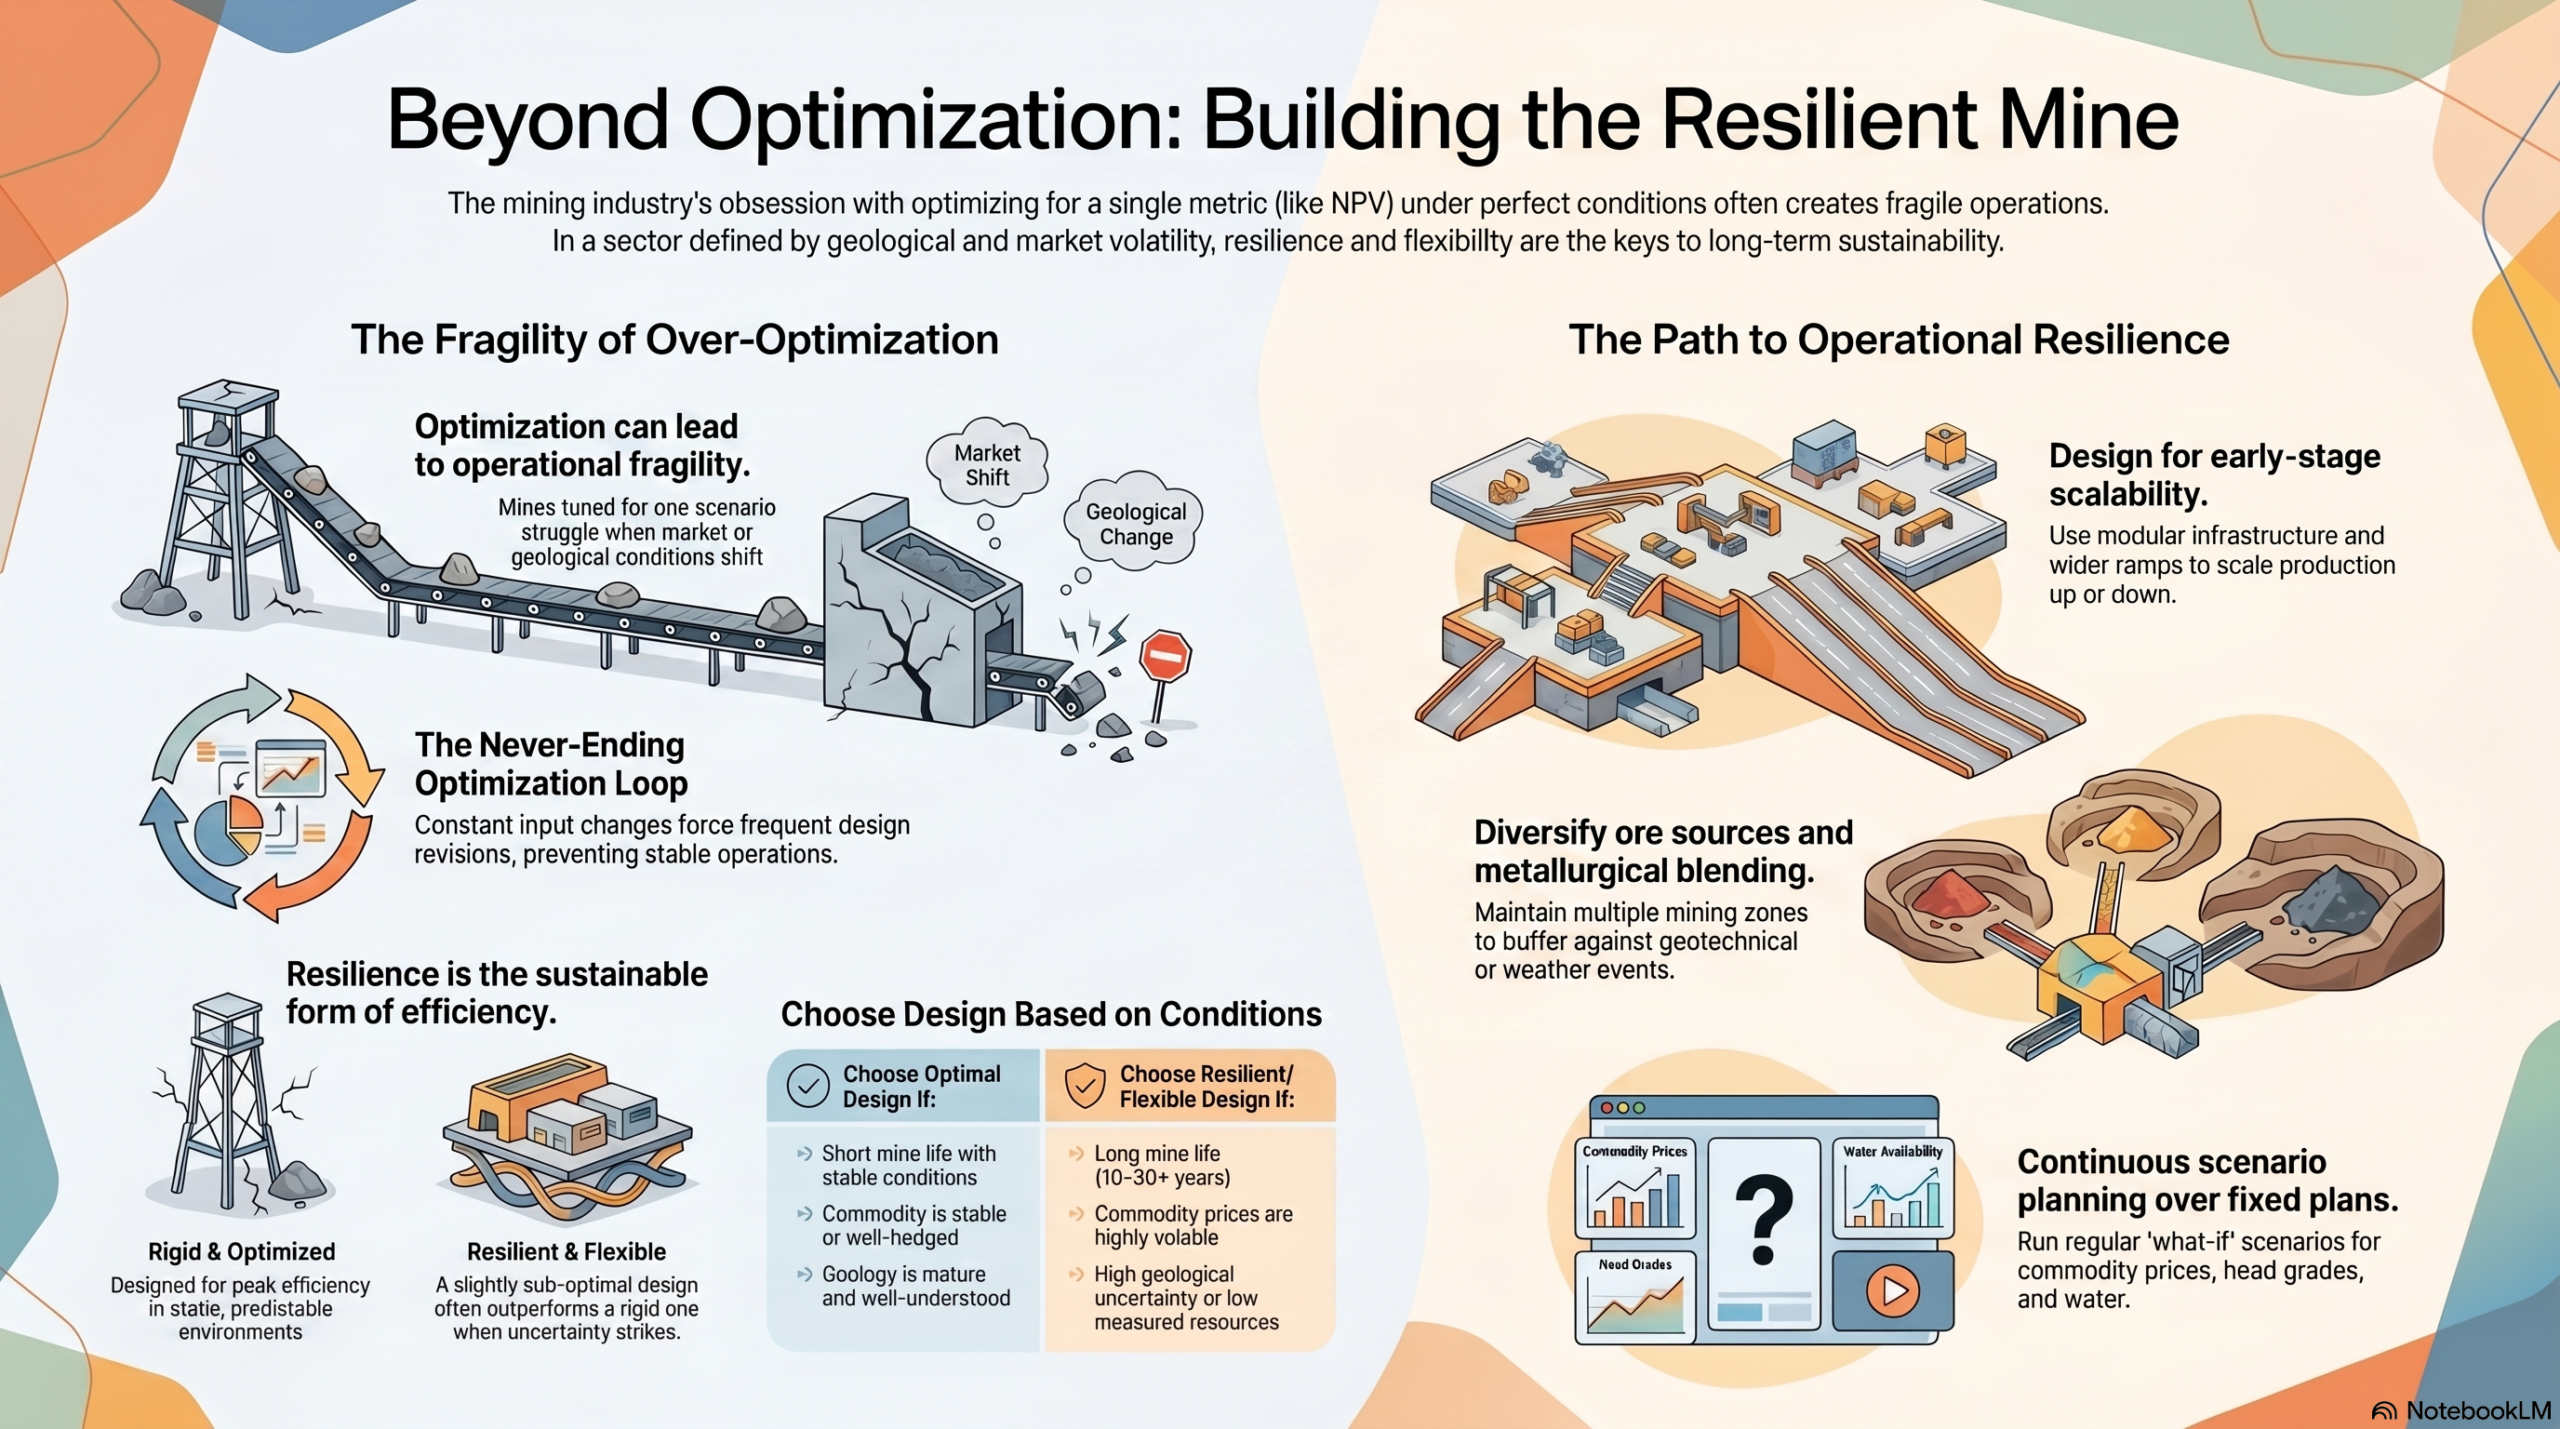

 Recently I have been seeing more mining studies proposing to use the dry stack approach. In some cases, they no longer even do the typical tailings trade-off study that look at different options. The decision is made upfront that dry stack is the preferred route due to its environmental acceptability and positive perceptions.
 The Guide covers several topics, including tailings characterization; site closure concepts; filtered tailings stack design; material transport, stacking systems; and tailings dewatering methods. The Guide covers all the basics very well. The one area that jumped out at me is the tailings characterization and testing aspect.
 Major miners, such as BHP and Rio Tinto, typically spare no expense on material testing for metallurgical or geotechnical purposes. They have the funds available to test and engineer to a high level to adequately de-risk the project to meet their investment thresholds.
 So, you just completed your initial PEA cashflow model and the resulting NPV and IRR are a little disappointing. They are not what everyone was expecting. They don’t meet the ideal targets of an IRR greater than 30% and an NPV that is more than 2x the initial capital cost. The project could now be on life support in the eyes of some.
 The discounting of cashflows in a cashflow model means that up-front revenues and costs have a bigger impact on the final economics than those far off in the future. This effect is amplified at higher discount rates.
 ake to the cashflow model. Sometimes several of the small ones, when compounded together, will result in a significant impact. Here are some of the other cashflow model adjustments that I have seen.
 Don’t let a disappointing NPV get you down. There may be a few ways to boost the NPV by applying some common practices. However, if after applying all of these adjustments, the NPV still isn’t great, something bigger may be required. That could be an entire project scope re-think.
 Part 2 of this blog post will focus on the remaining engineering work to finish Chapter 16 of the Technical Report. We only wrote about half of it in Part 1. The mining engineer can generally handle the rest of these tasks in this Chwithout requiring a lot of external input. You can read Part 1 at this link “
 Two dilution approaches are common. One can either construct a diluted block model; or one can apply dilution afterwards in the production schedule. I have used both approaches at different times.
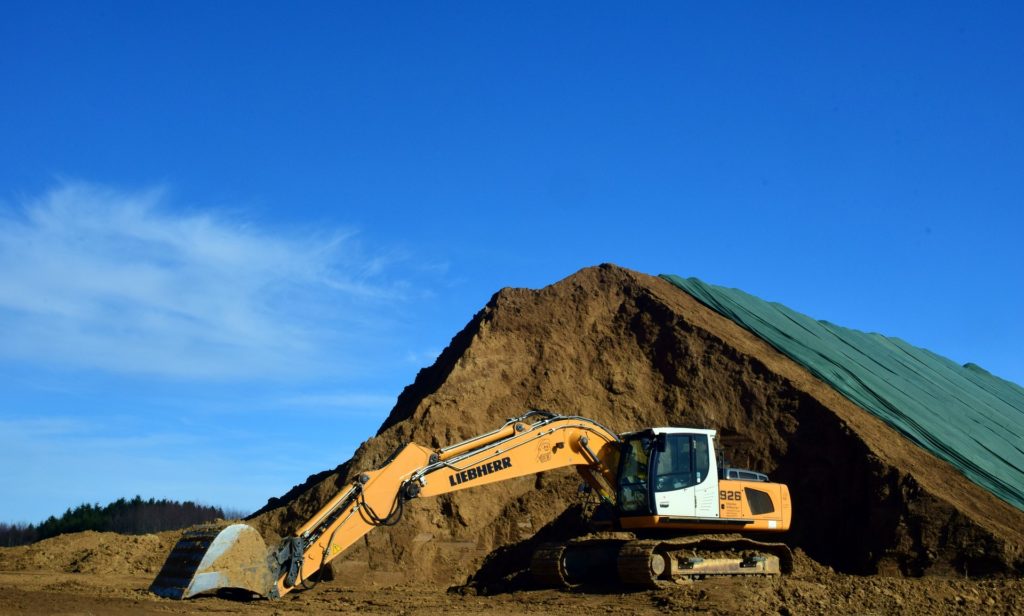 Sometimes lower grade stockpiles are built up by the mine each year but only processed at the end of the mine life. Periodically the ore mining rate may exceed the processing rate and other times it may be less. This is where the stockpile provides its value, smoothing the ore delivery to the plant.
 Once the production schedules are finalized, they are normally reviewed by the client for approval. The strip ratio and ore grade profile by date are of interest. One may then be asked to look to at different stockpiling approaches to see if an NPV (i.e. head grade) improvement is possible.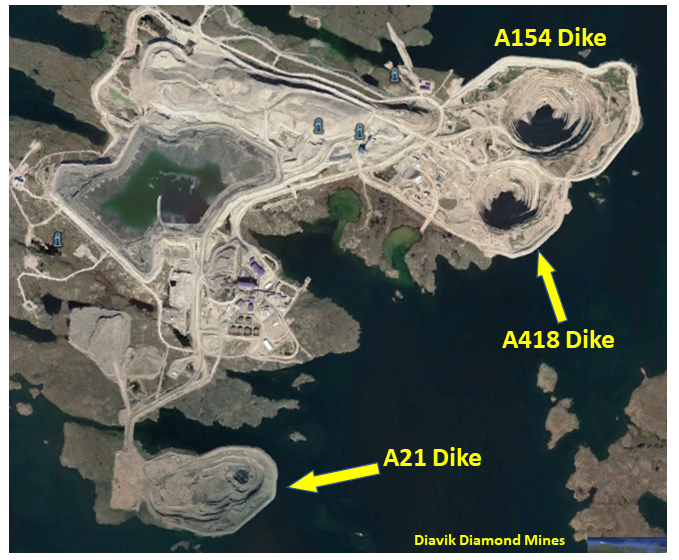
 The last task for the mine engineer in Chapter 16 is estimating the open pit equipment fleet and manpower needs. The capital and operating costs for the mining operation will also be calculated as part of this work, but the costs are only presented in Chapter 21.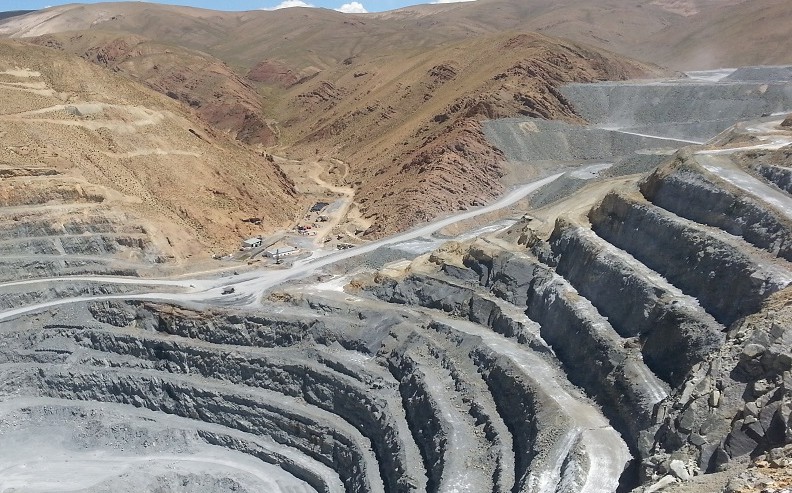
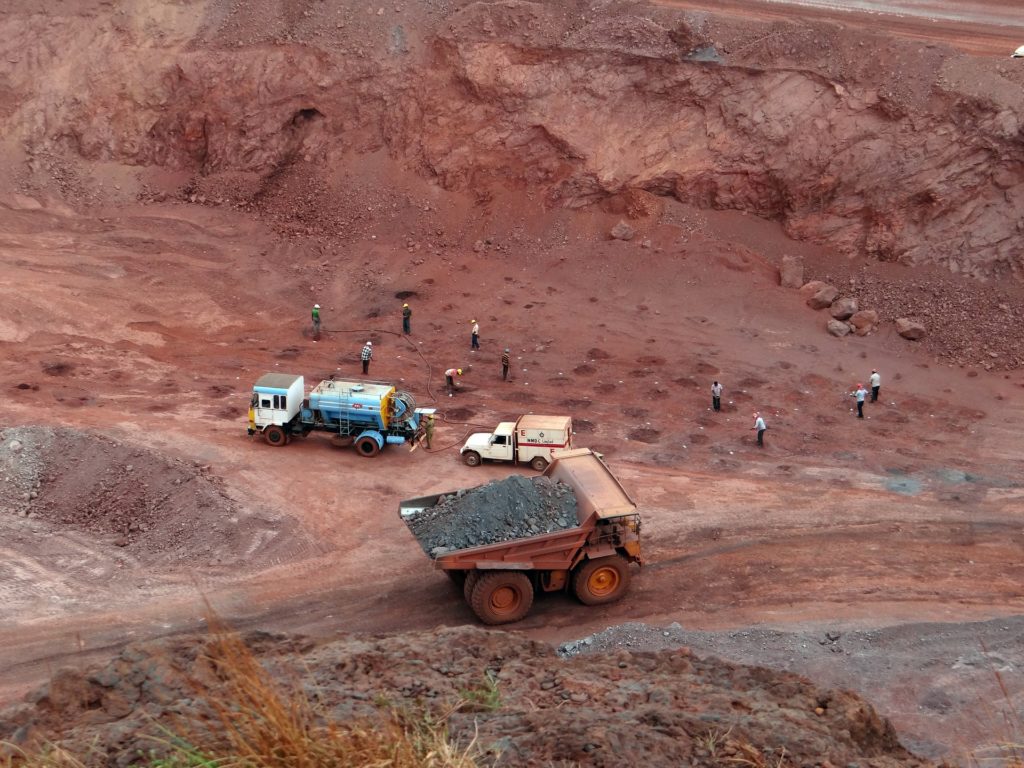 The support equipment needs (dozers, graders, pickups, mechanics trucks, etc.) are typically fixed. For example, 2 graders per year regardless if the annual tonnages mined fluctuate.
 These two blog posts give an overview of some of the things that mining engineers do as part of their jobs. Hopefully the posts also shed light on the amount of work that goes into Chapter 16 of a 43-101 report. While that chapter may not seem that long compared to some of the others, a lot of the effort is behind the scenes.
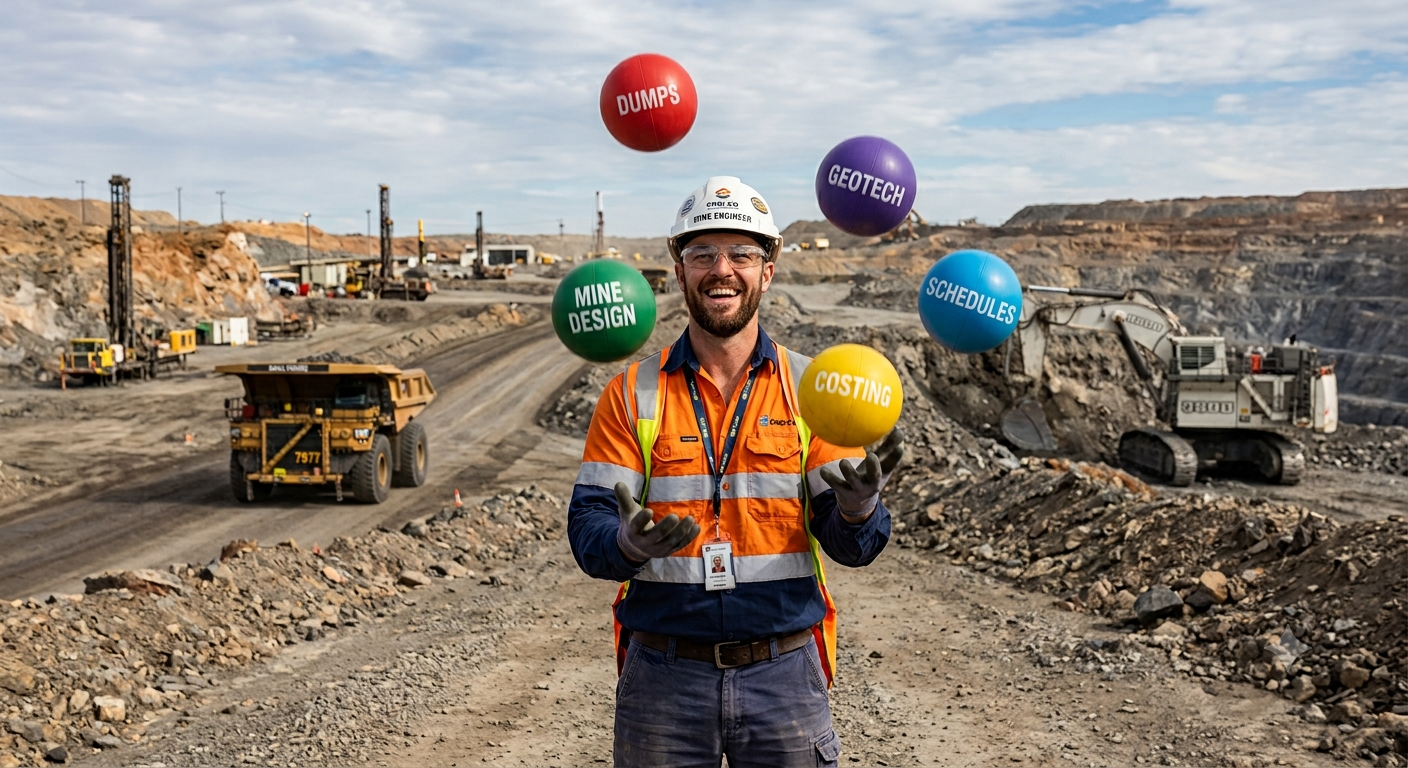 When people asl what I do and learn that I’m a mining engineer, I’ll normally get perplexed looks. Most people don’t even knew the job exists
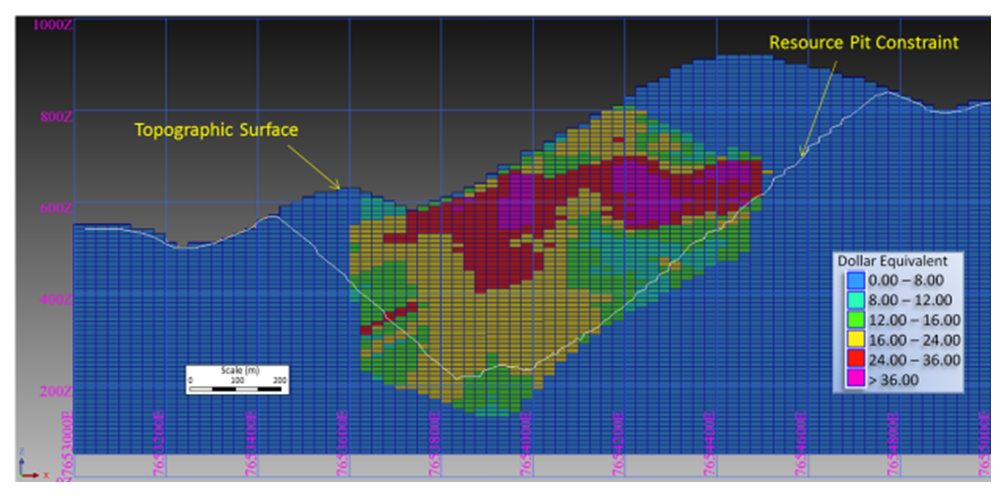 There is always a mineral resource estimate available before doing a PEA. The way the resource is being reported will indicate what type of mine this likely is. The geologists have already done some of the mining engineer’s work.
 Before starting pit optimization, we require economic inputs from several people. The base case metal prices must be selected (normally with input from the client). The mining operating cost per tonne must be estimated (by the mining engineer). The processing engineers will provide the processing cost and recovery for each ore type.
 Once the optimization is run, a series of nested pit shells are created, each with its own tonnes and grade. These shells are compared for incremental strip ratio, incremental head grade, total tonnes, and contained metal.
 The mining engineer is now ready to undertake the pit design. The pit design step introduces a benched slope profile, smooths out the pit shape, and adds haulroads. Hence a couple of key input parameters are required at this time. The mining engineer will need to know the geotechnical pit slope criteria and the truck size & haul road widths. Let’s look at both of these.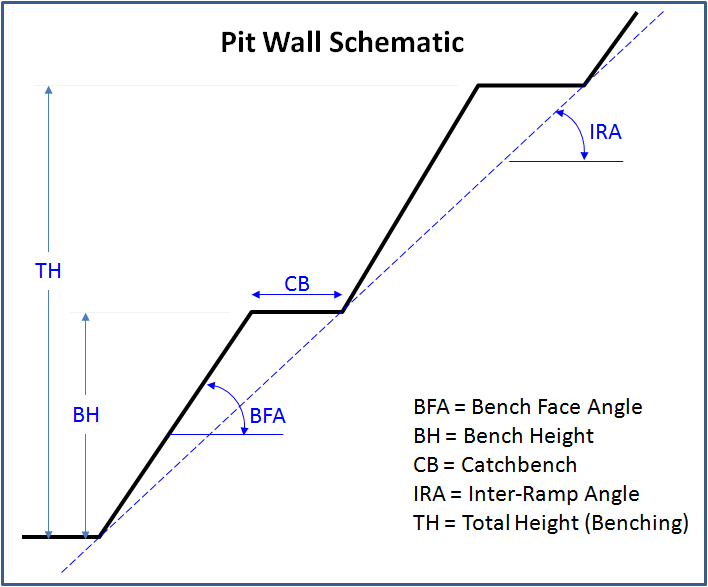
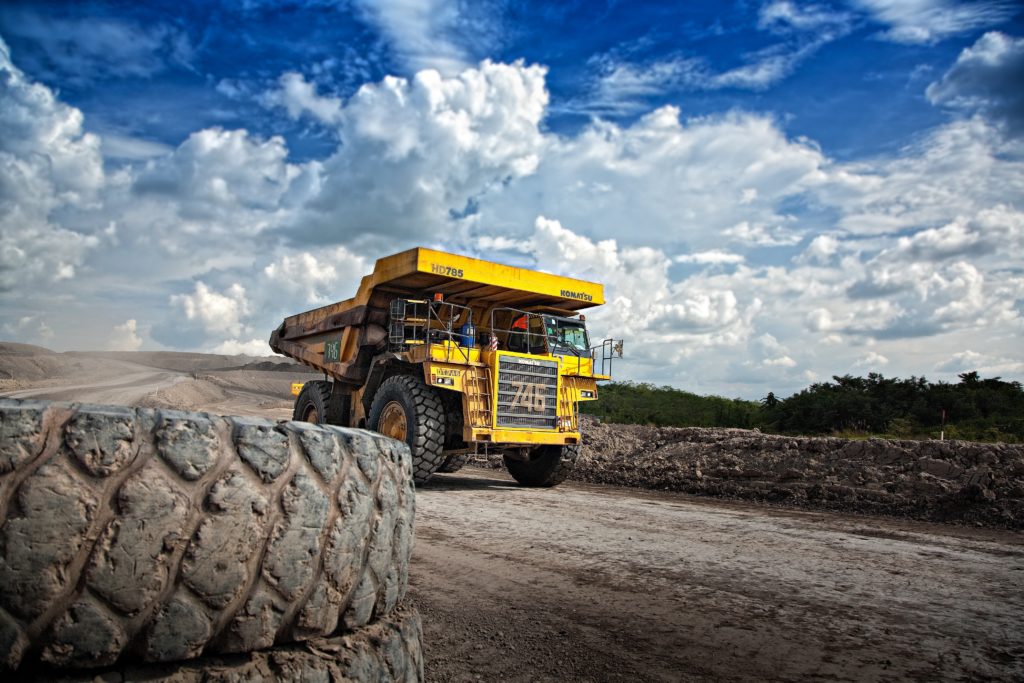 Ramps: Next the mining engineer needs to select the truck size, even though the production schedule has not yet been created.
 This ends Part 1. In Part 2 we will discuss the mining engineer’s next tasks; production scheduling; waste dump design; and equipment selection. The mining engineer QP will sign off and take responsibility for all the mine design work done so far. You are probably wondering why you didn’t select mining engineering as a career. Part 2 is at this link “
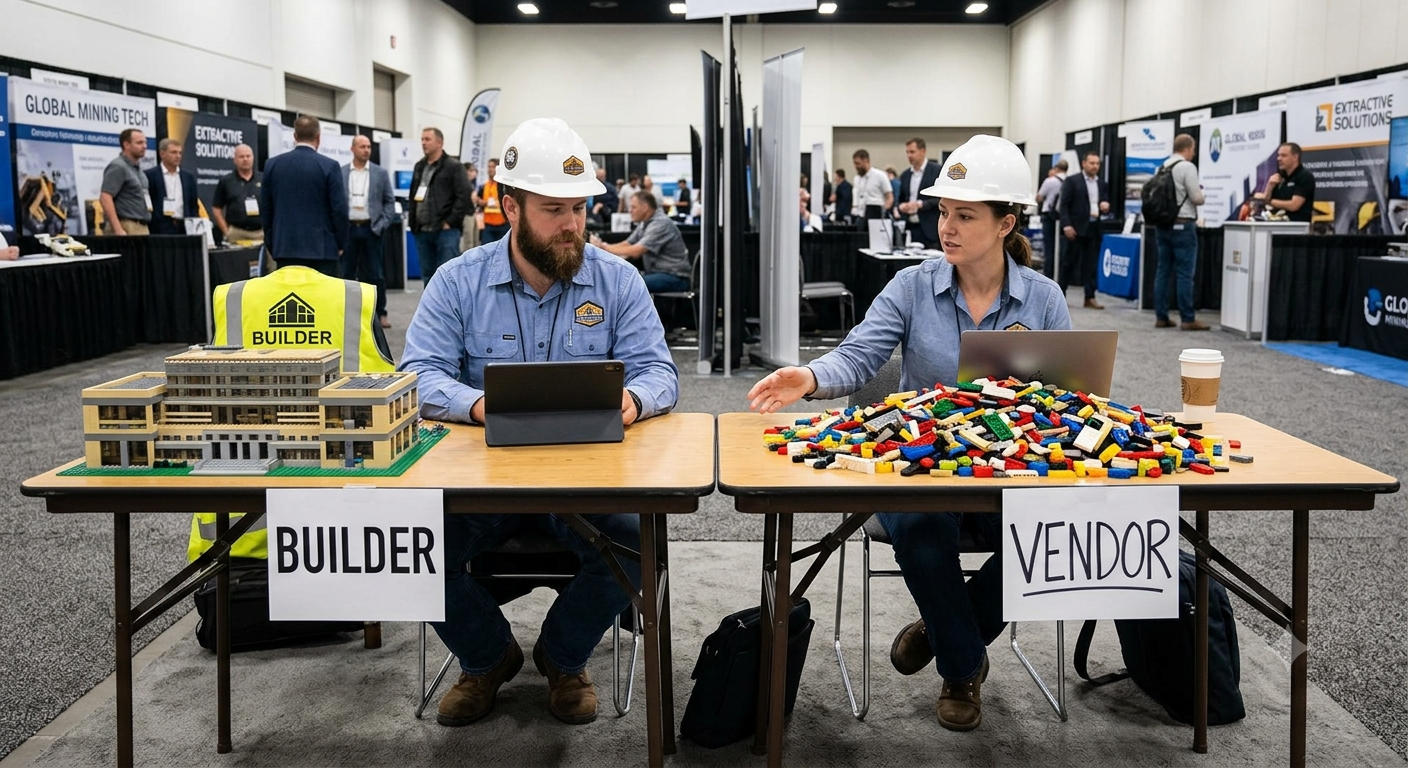 Normally Major and Intermediate miners advance their projects through the study stages with the ultimate intent to actually build the mine. Sometimes they may opt to sell their project if it no longer fits in their long term strategy or if they desperately need some cash. However, selling the project when it was first acquired was likely not their initial intent. They want to be on a Mine Builder path.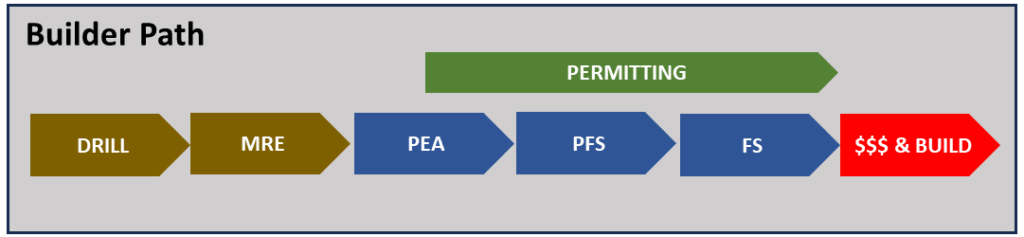
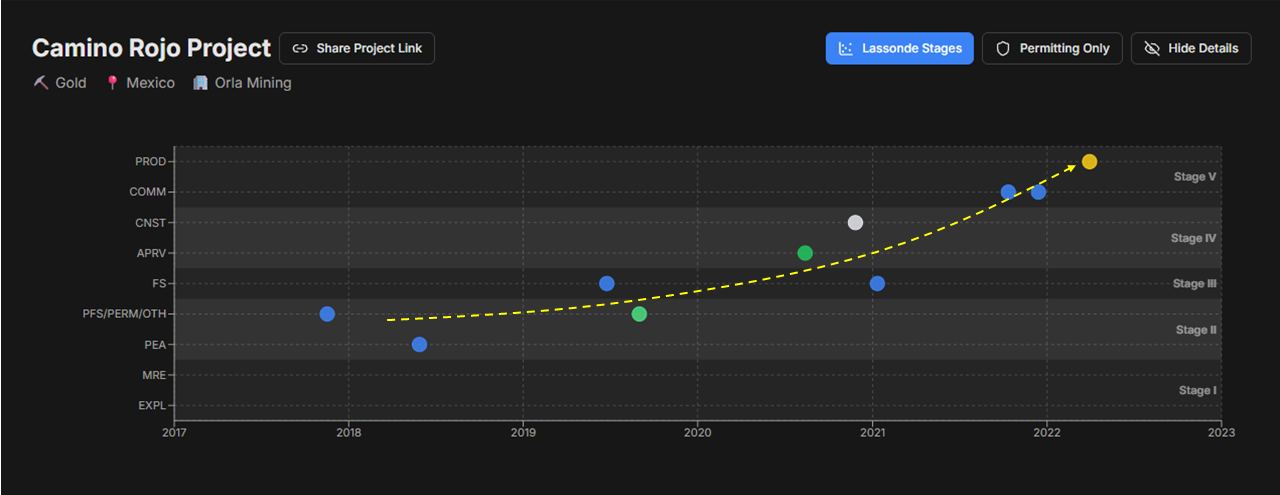
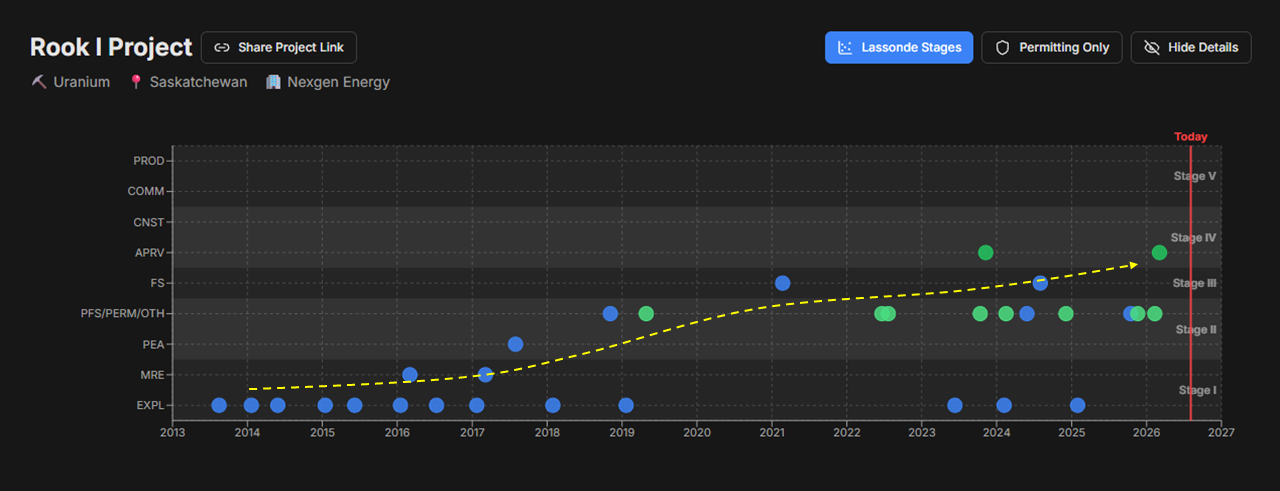
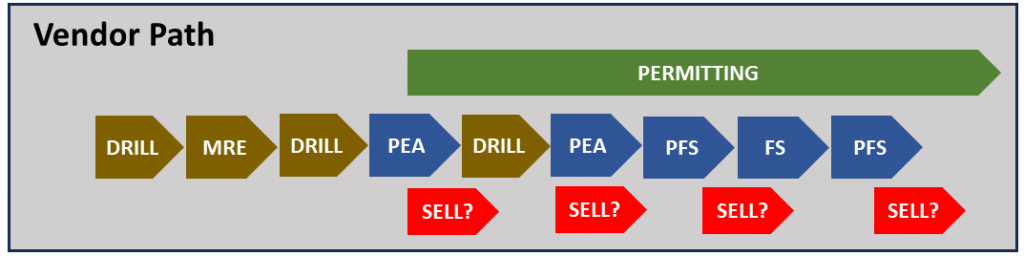
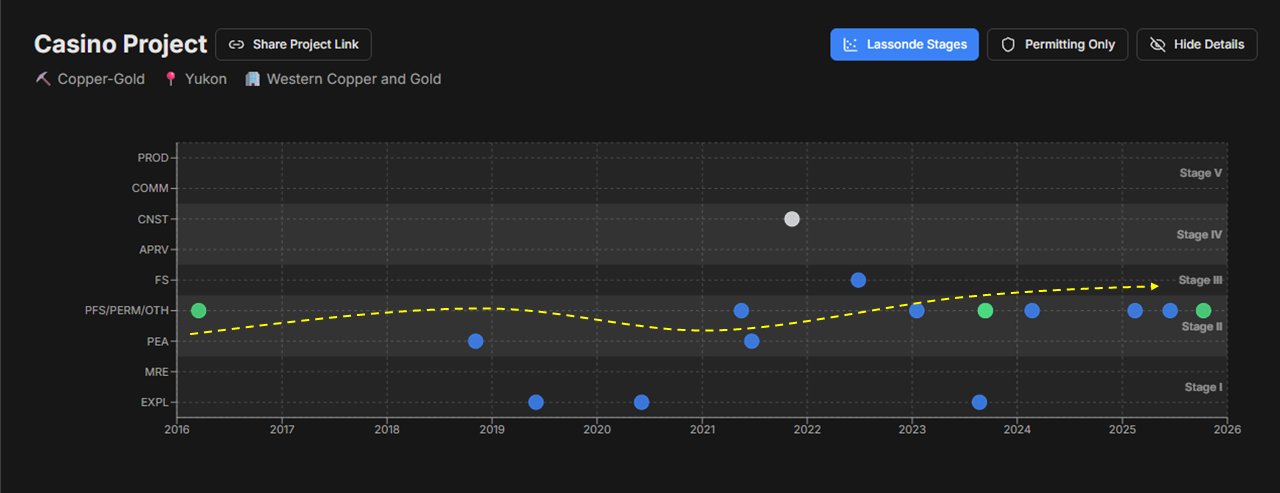
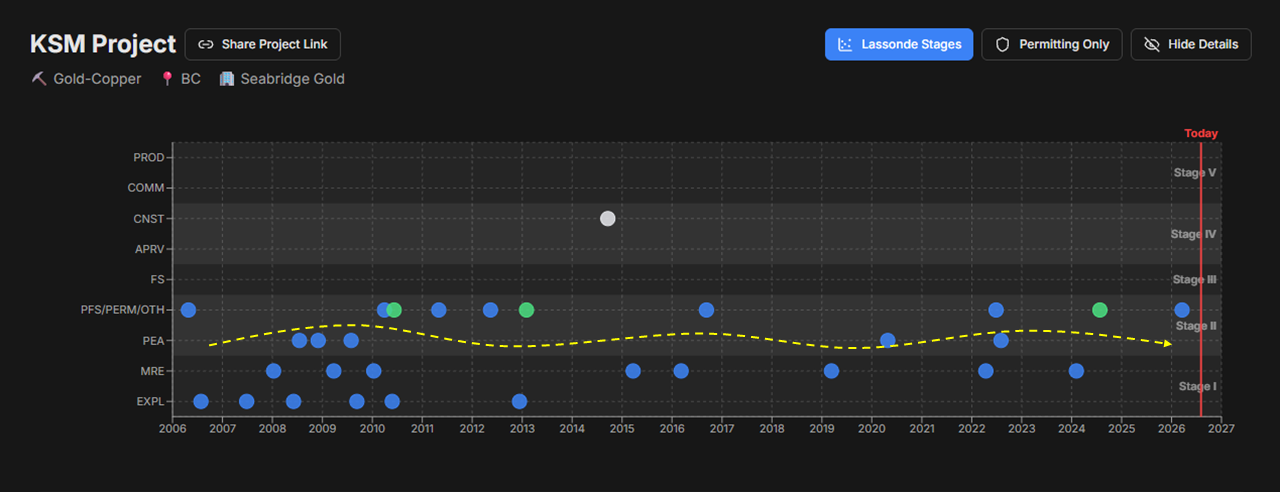
 If an engineer understands that a Mine Builder’s project will move from PEA to PFS to FS in rapid succession, then there is more incentive to ensure each study is somewhat integrated.
 As an engineer, it is helpful to understand the objectives of the project owner and then tailor the technical studies to meet those objectives. This does not mean low balling costs to make the study a promotional tool. It means focusing on what is important. It means recognizing the path, and what doesn’t need to be engineered in detail at this time. This may save the client time, money, and improve credibility in the long run.

 NPV One is targeting to replace the typical Excel based cashflow model with an online cloud model. It reminds me of personal income tax software, where one simply inputs the income and expense information, and then the software takes over doing all the calculations and outputting the result.
 Pros
Pros Like anything, nothing is perfect and NPV may have a few issues for me.
 The NPV One software is an option for those wishing to standardize or simplify their financial modelling.