Articles tagged with: Mine Engineering

Mining Dilution Prediction – Its Not That Simple

mining reserve estimation
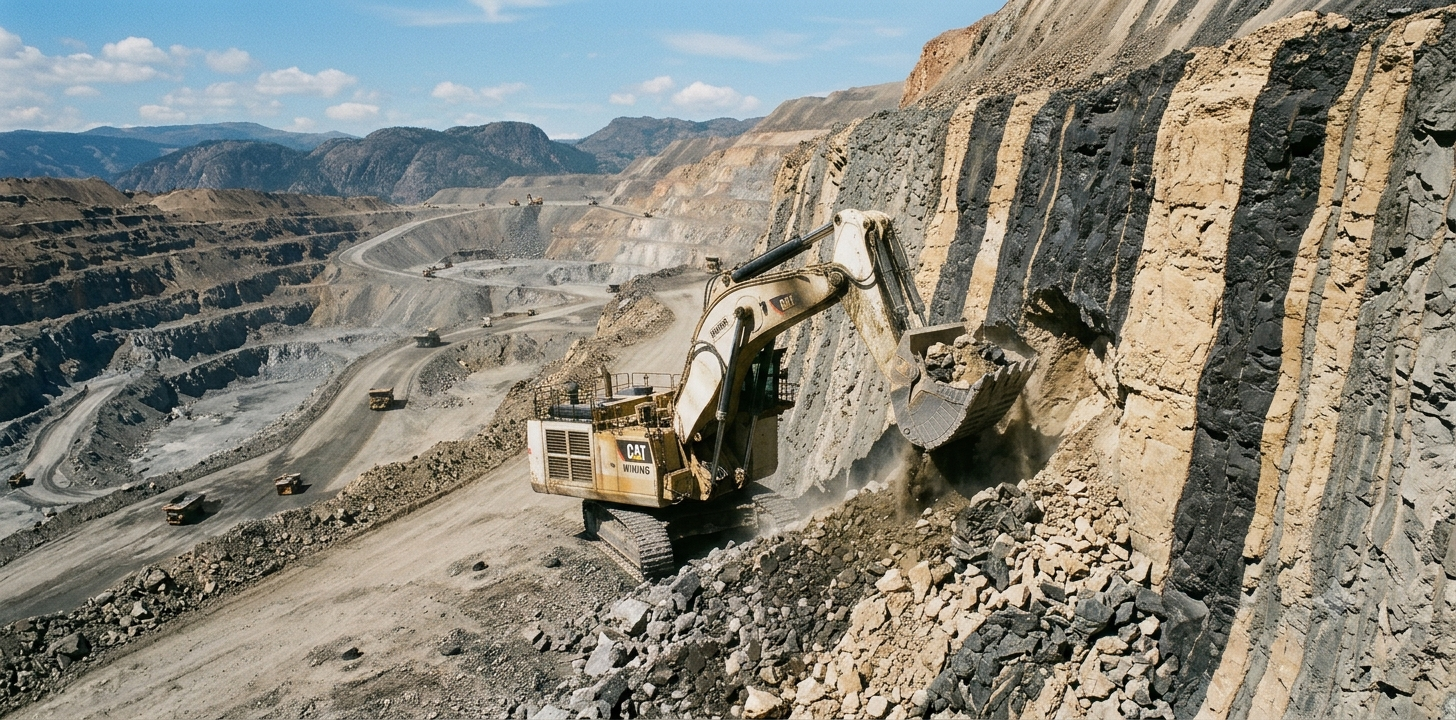
Over the years of working on studies and reviewing them, ore dilution often does not see much discussion but it is one of the most important technical and operational issues. It plays a key role in the success of a mining operation, particularly underground operations.  In studies, it can be too low or too high, too optimistic or too pessimistic.
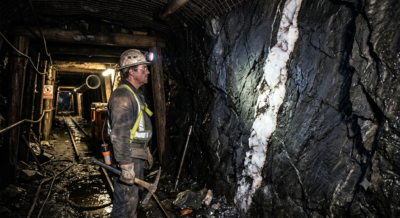
Project economics (NPV, IRR) can see significant impacts depending on the applied dilution factor.  They are numerous instances where mines have been put into production, and excess dilution has subsequently led to their downfall. At the West Red Lake Madsen mine, gold head grades  were forecast to be around 7-8 g/t (2025 PFS Table 22-1) but in reality production head grades are closer to 3.5-4.3 g/t (July 15, 2026 NR).  Is this due to dilution or a change in mining plans – I don’t know – but dilution could be part of the reason.
Hence mine designers need to take the time to think about what dilution will be applied in the production forecast and the basis for that decision.

Everyone has a preferred dilution method.

Dilution is the mixing of waste with ore during mining, sometimes by design and sometimes unavoidable, but never desired. It must be applied in the mine plan to forecast the head grade that the processing plant will see.   Over the years I have seen several different approaches for modelling and applying dilution in a mining study.
It seems that engineers and geologists have their own personal favorites and tend to stick with them.   Here are some common dilution approaches that I have seen (and used myself).
1. Pick a Number:
This dilution approach is quite simple and sometimes used in very early stage assessments.  Just pick a number that sounds appropriate for the orebody and the mining method.  There might not be any solid technical basis for the dilution value, but as long as it seems reasonable, it might go unchallenged.  Possibly one uses a dilution value commonly seen in other studies.
2. SMU Regularization:
This dilution approach takes each resource model percent block (e.g.  a block is 20% waste and 80% ore) and mathematically regularizes it into a single Selective Mining Unit (“SMU”) block with a weighted average grade.  The SMU compositing approach will dilute the ore in the block with the contained waste.  Ultimately this step might convert some highly diluted ore blocks to waste once a cutoff grade is applied.  Internal ore blocks that are 100% ore would not be diluted.  Some engineers may apply an additional dilution factor beyond this SMU compositing to be safe, while others will consider the block model fully diluted at this step and move onto scheduling.
3. Diluting Envelope:
This dilution approach assumes that a 1 to 3 metre wide waste envelope surrounds the ore zone.  It assumes that the envelope will be mined along with the ore.  The width of the waste envelope may be based on the blast hole spacing used to define ore and waste contacts for mining.
The diluting grade of the waste envelope can be estimated or one may simply assume a more conservative zero-diluting grade.   In this approach, an average dilution factor can be applied to the final production schedule to arrive at the diluted tonnages and grades sent to the process plant.
With this approach, narrow orebodies would be diluted more heavily than bulk orebodies.
4. Diluted Block Model:
This dilution approach uses more complex logic to look at individual blocks in the block model.  One determines how many waste contact sides each block has, and then mathematically applies dilution based on the number of those contacts.  A block with waste on three sides would be more heavily diluted than a block with waste only on one side an edge block).   Usually this approach relies on a direct swap of ore with waste being neighboring blocks.  If a block gains 100 m3 of waste, it must then lose 100 m3 of ore to maintain the volume balance.   The production schedule derived from such a “diluted” block model usually applies no subsequent dilution factor.   Sometimes it can be complex to quantify the % dilution from this approach.
5. Using UG Stope Modelling
I have also heard about, but not yet used, a method of applying open pit dilution by adapting an underground stope
modelling tool.  By considering an SMU as a stope, automatic stope shape creators such as Datamine’s
Mineable Shape Optimiser (MSO) can be used to create wireframes for each mining unit over the entire
deposit. Using these wireframes, the model can be sub-blocked and assigned as either ‘ore’ (inside the
wireframe) or ‘waste’ (outside the wireframe) prior to optimization.


When is the Cutoff Grade Applied?

Depending on which dilution approach is used, the cutoff grade will be applied either before or after dilution.   When the dilution approach requires adding dilution to the final production schedule, then the ore / waste cutoff grade will be applied to the undiluted block model (approach #1 and #2).
When dilution is incorporated into the block model itself (#3 and #4), then the cutoff grade is applied to the diluted blocks.
The timing of when the cutoff grade is applied to the model will have an impact on the ore tonnes and head grade being reported.

Applying dilution in pit optimization?

Another occasion when dilution may be applied is during pit optimization.  In the optimization software, there are normally input fields for both a dilution factor and an ore loss factor.   Some engineers will apply an estimated dilution at this step while others will leave the factors at zero.  There are valid reasons for either approach.
My preference is use a zero dilution factor for pit optimization since the character of the ore zones will be different at different revenue factors; hence dilution would be unique to each.   It would be good to examine the impact that the dilution factor has on pit optimization by running with and with to see the results.

Conclusion

The goal of dilution estimation is not to demonstrate fancy mathematics, but to forecast what it will actually be.  My personal experience is that people tend to focus on the value of the dilution percentage and whether it seems reasonable in the end.   There seems to be less focus on the logic for the dilution approach used.  It is not easy to forecast dilution yet it can be an incredibly important number.
Regardless of which approach is being used, ensure that one can quantify the percent dilution being applied – is it 5%  or 20% dilution?
Others may yet have different dilution methods in their toolbox and it would be interesting to hear about them.
Another blog post discusses dilution from an underground mining perspective in a bit more detail.  This discussion was written by another engineer who permitted me to share their paper.    You can read that blog at “Ore Dilution – An Underground Perspective“.
Note: You can sign up for the KJK mailing list to get notified when new blogs are posted. Follow me on Twitter at @KJKLtd for updates and other mining posts. The entire blog post library can be found at https://kuchling.com/library/
For some free mining calculator apps, including project timelines and a simplified cashflow modeller, check out this website https://sites.google.com/view/drillingdown


 

Share

Does the Mining Industry Employ Interns?

employing interns
Over the couple of years I have been working on a side project in the tech industry.   One of the things that struck me was the hiring of interns, both paid and unpaid.
I’m now aware that interns are being hired in other industries such as legal, politics, journalism, and marketing.  However I have never come across the use of interns within the mining industry.
Intern

Why hire interns?

I was recently talking to a marketing consultant about tips on tech marketing and one of the suggestions she made was to hire an unpaid intern.  They would do much of the legwork of finding sales contacts and establishing contact with them.
My first question was why would anyone work for free?  There are  three main reasons:
  1. For school credit; as part of a course credit in college or university where an internship is part of the program requirement.
  2. For experience; it is difficult to get a real job without experience and so the internship teaches, builds  experience, and establishes a portfolio of work.
  3. Networking; building up industry connections can possibly lead to permanent work down the road.

Its the right thing to do

At first I was taken aback at the thought of asking someone to work for my company for free.  Are we that cheap?
Thinking about it further, if you are paying someone a salary the expectation is that they should be somewhat skilled at their job.  I have come to realize that the internship may actually be a win-win for both parties.

Its a win-win

The company gets a chance to learn about potential employees and also gets productive service from them.
The intern gains employment experience and learns about the realities of the business world.  Students have already paid the schools to teach them.  Now businesses can help teach them more, but at no cost.   It’s a win-win for both.
So how did our unpaid intern search go?  We posted a free ad on indeed.ca.  Within 72 hours we received over ten replies, of which only 2-3 came close to meeting the actual qualifications.  Some of the applicants had no relevant experience at all.
Possibly in today’s job market people are willing to work for free on the hope that they can get some experience, which will hopefully lead to a permanent job in the future.

Conclusion

The question is whether the mining industry can make use of interns in the areas of geology, engineering, marketing, presentation graphics, websites, etc?
There may be many students or recent grads looking for an opportunity and are willing to do whatever it takes to  advance their careers.
Even if your operating budget can’t afford the cost of hiring another person, you may still have a chance to help out someone new in the industry.
Note: You can sign up for the KJK mailing list to get notified when new blogs are posted.
Share

Underground Feasibility Forecasts vs Actuals

underground costing
I recently attended a CIM Management and Economics Society presentation here in Toronto discussing the differences between actual underground production versus the forecast used in the feasibility study. The presenter was Paul Tim Whillans from Vancouver Canada.
His topic is interesting and relevant to today’s mining industry.  Paul raised many thoughtful points supported by data. He gave me permission to share his information.
The abstract for his paper is inerted below.  The paper can be downloaded at this LINK and here are the presentation slides.

ABSTRACT

An underground mining study that is done in accordance with NI43-101, JORC or similar reporting code is generally assumed by the public to be representative, independent and impartial. However, it has been well documented by academics and professionals in our industry that there is a sharp difference between the forecasts presented in these underground studies and the actual costs when a mine is put into production.
For underground mines, the risks associated with obtaining representative information are much greater than for surface mining and the cost of accessing underground ore is also proportionally much greater. There is a pressing need to align expectations, by improving the accuracy of projections. This will result in reduced risk to mining companies and investors and provide more reliable information to government agencies, the public, and more importantly, the communities in which the proposed mine will operate.
The objective of this article and an article currently being written titled “Mining Dilution and Mineral Losses” is to:
– Discuss the dynamics of intention that lead to over-optimism;
– Provide simple tools to identify which studies are likely to be more closely aligned with reality;
– Identify some specific points where underground mining studies are generally weak;
– Discuss practices currently in use in our industry that lead to a composite or aggregate effect of over optimism;
– Describe the effects of overly optimistic studies;
– Outline specific changes that are necessary to overcome these challenges; and
– Stimulate discussion and awareness that will lead to better standards.”

Conclusion

I agree with many of the points raised by Paul in his study. The mining industry has some credibility issues based on recent performance and therefore understanding the causes and then repairing that credibility will be important for the future.
Credibility ultimately impacts on shareholder returns, government returns, local community benefits, and worker health and safety; so having a well designed mine will realize benefits for many parties.
If you need more information Paul’s website is at http://www.whillansminestudies.com/
Note: You can sign up for the KJK mailing list to get notified when new blogs are posted.
Share

Ore Stockpiling – Why are we doing this again?

ore stockpile
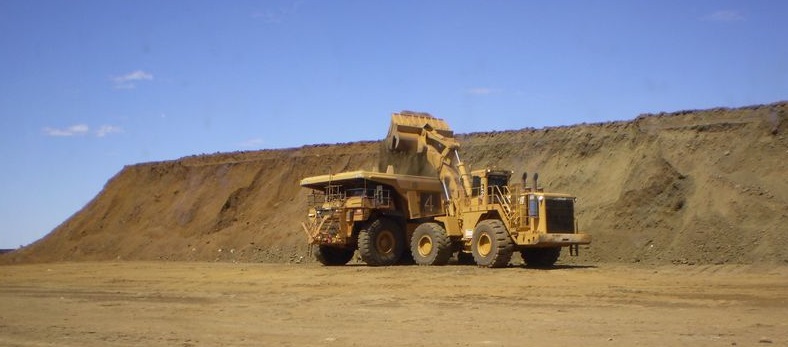
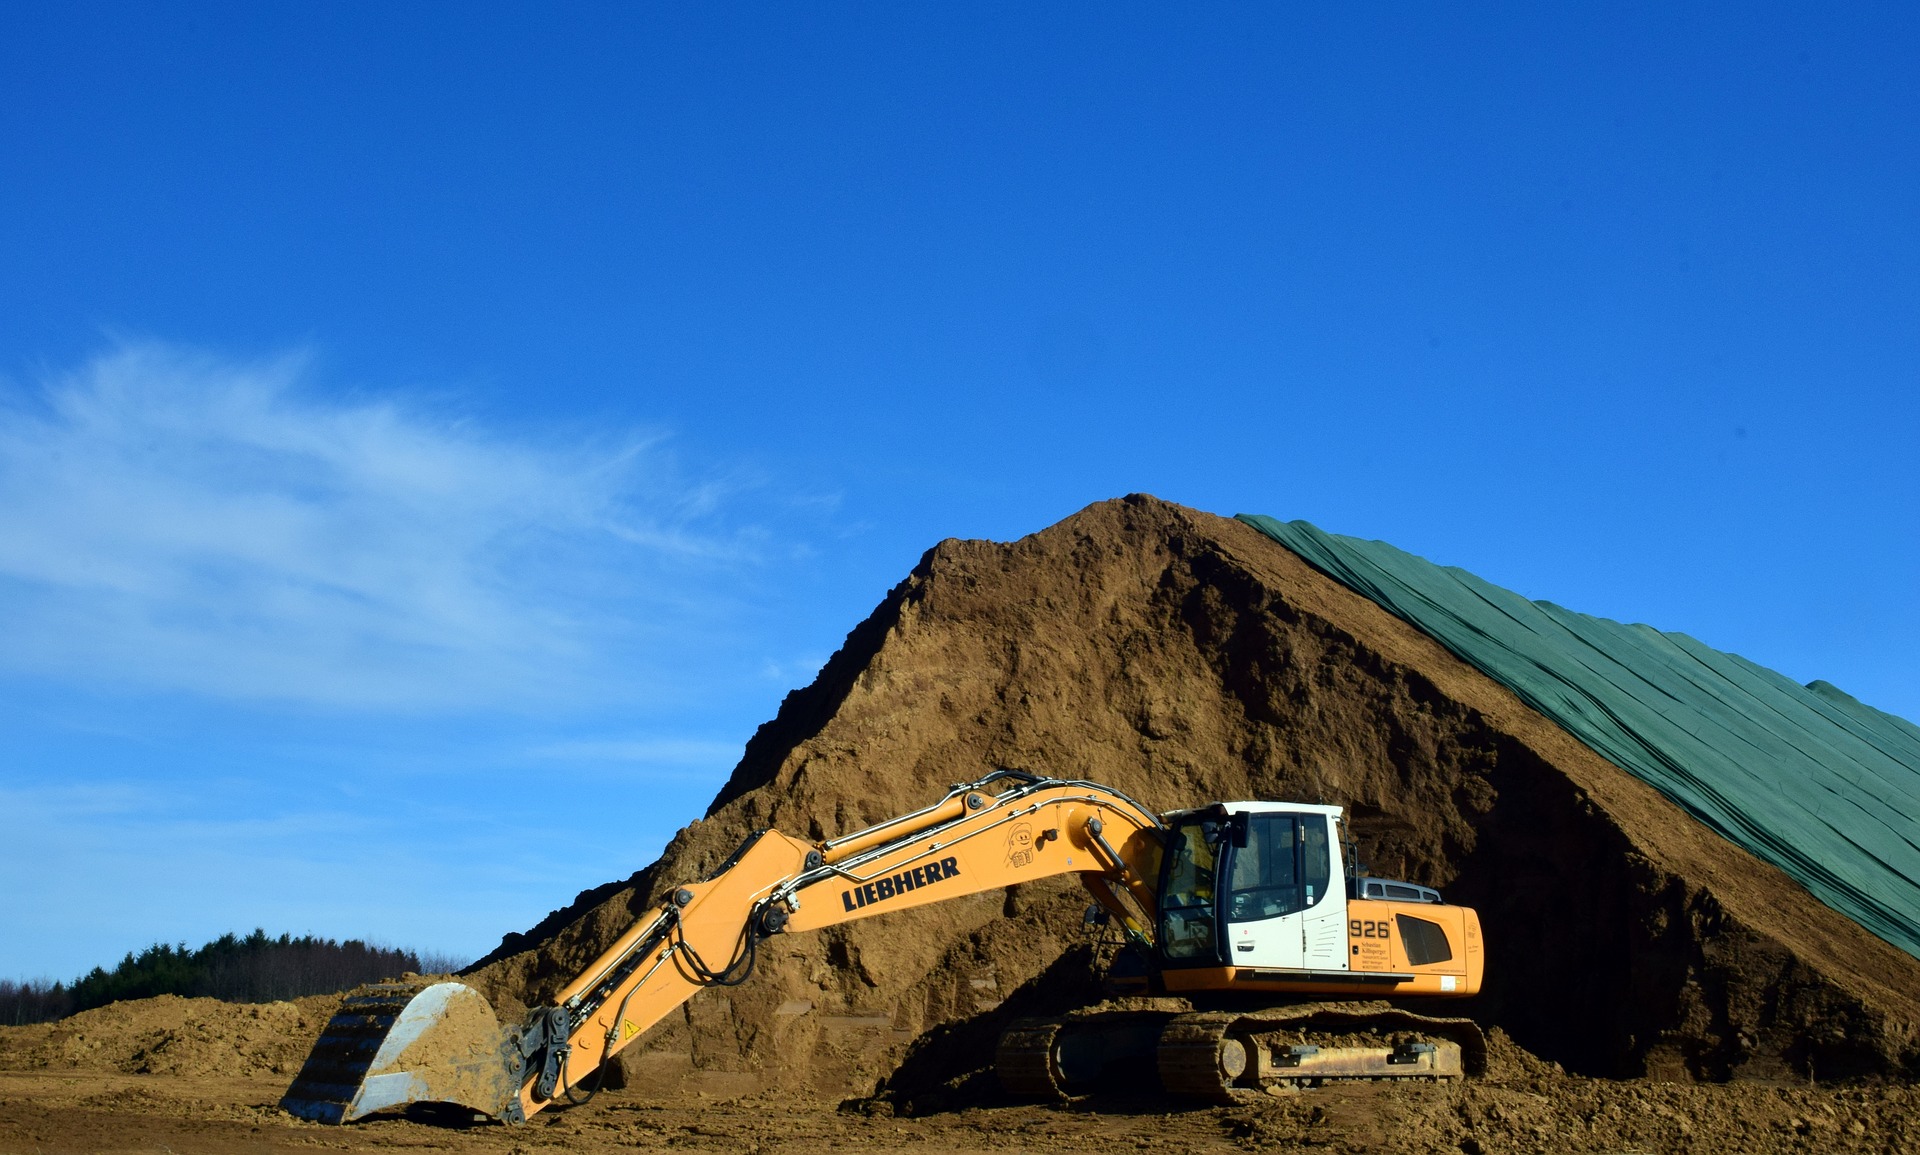
In many of the past mining studies that I have worked, stockpiling strategies were discussed and usually implemented. However sometimes team members were surprised at the size of the stockpiles that were generated by the production plan. In some cases it was apparent that not all team members were clear on the purpose of  stockpiling or had preconceived ideas on the rationale behind it. To many stockpiling may seem like a good idea until they saw it in action.
Mine Stockpile
In this blog I won’t go into all the costs and environmental issues associated with stockpile operation.  The discussion focuses on the reasons for stockpiling and why stockpiles can get large in size or numerous in quantity.
In my experience there are four main reasons why ore stockpiling might be done. They are:
1. Campaigning: For metallurgical reasons if there are some ore types that can cause process difficulties if mixed  with other ores. The problematic ore might be stockpiled until sufficient inventory allows one to process that ore (i.e. campaign) through the mill. Such stockpiles will only grow as large as the operator allows them to grow. At any time the operator can process the material and deplete the stockpile. Be aware that mining operations might still be mining other ore types, then those ores may need to be stockpiled during the campaigning.  That means even more ore stockpiles at site.
2. Grade Optimization: This stockpiling approach is used in situations where the mine delivers more ore than is required by the plant, thereby allowing the best grades to be processed directly while lower grades are stockpiled for a future date. Possibly one or more grade stockpiles may be used, for example a low grade and a medium-low grade stockpile. Such stockpiles may not get processed for years, possibly until the mine is depleted or until the mined grades are lower than those in the stockpile. Such stockpiles can grow to enormous size if accumulated over many years.  Oxidation and processability may be a concern with long term stockpiles.
3. Surge Control: Surge piles may be used in cases where the mine may have a fluctuating ore delivery rate and on some days excess ore is produced while other days there is underproduction. The stockpile is simply used to make up the difference to the plant to provide a steady feed rate. These stockpiles are also available as short term emergency supply if for some reason the mine is shut down (e.g. extreme weather). In general such stockpiles may be relatively small in size since they are simply used for surge control.
4. Blending: Blending stockpiles may be used where a processing plant needs a certain quality of feed material with respect to head grade or contaminant ratios (silica, iron, etc.). Blending stockpiles enables the operator to ensure the plant feed quality to be within a consistent range. Such stockpiles may not be large individually; however there could be several of them depending on the nature of the orebody.
There may be other stockpiling strategies beyond the four listed above but those are the most common.

Test Stockpiling Strategies

Using today’s production scheduling software, one can test multiple stockpiling strategies by applying different cutoff grades or using multiple grade stockpiles. The scheduling software algorithms determine whether one should be adding to stockpile or reclaiming from it. The software will track grades in the stockpile and sometimes be able to model stockpile balances assuming reclaim by average grade, or first in-first out (FIFO), or last in-first out (LIFO).
ore stockpile
Stockpiling in most cases provides potential benefits to an operation and the project economics. Even if metallurgical blending or ore campaigning is not required, one should always test the project economics with a few grade stockpiling scenarios.
Unfortunately these are not simple to undertake when using a manual scheduling approach and so are a reason to move towards automated scheduling software.
Make sure everyone on the team understands the rationale for the stockpiling strategy and what the stockpiles might ultimately look like. They might be surprised.
Note: If you would like to get notified when new blogs are posted, then sign up on the KJK mailing list on the website.   Follow us on Twitter at @KJKLtd for updates and insights.
Share

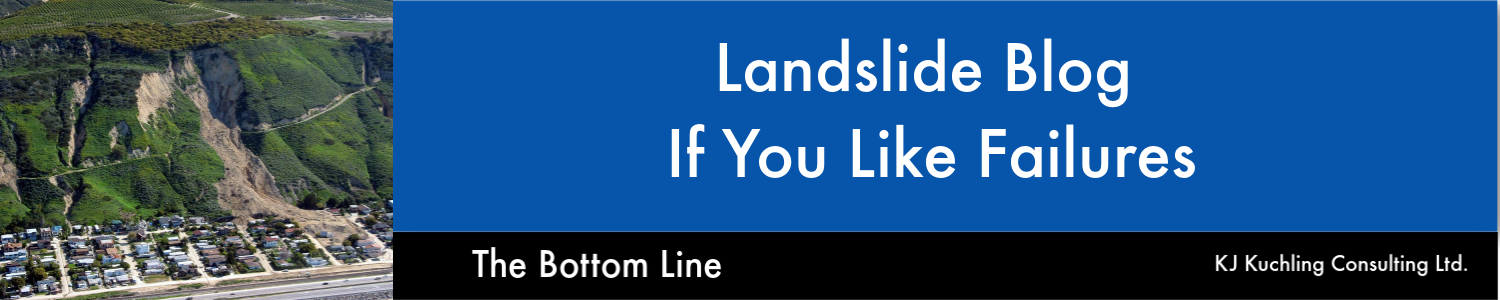
Landslide Blog – If You Like Failures

slope failure blog
For those of you with a geotechnical background or have a general interest in learning more about rock slides and slope failures, there is an interesting website and blog for you to follow.
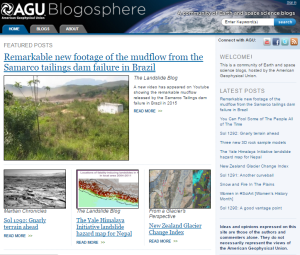
The website is hosted by the American Geophysical Union the world’s largest organization of Earth and space scientists. The blogs on their site are written by AGU staff along with contributions from collaborators and guest bloggers.

Landslide Blog screenshot

The independent bloggers have editorial freedom in the topics they choose to cover and their opinions are those of their authors and do not necessarily represent the views of the American Geophysical Union. This provides for some leeway on the discussions and the perspectives the writers wish to take.

Landslide Blog

One specific area they cover well in their Landslide Blog are the various occurrences of rock falls and landslides from any location around the globe. They will present commentary, images, and even videos of slope movements as they happen.
Often they will provide some technical opinion on what possibly caused the failure event to occur. The Landslide Blog has a semi-regular email newsletter that will keep you updated on new stories as they happen.
The following links are a few examples of the type of discussions they have on their website.
Here is a description of a small water dam failure in Greece.
Here is some video of the Samarco tailings runout in Brazil.
From time to time the Landslide Blog will examine mine slopes, tailings dams, and waste dump failures, however much of their information relates to natural earth or rock slopes along roads or in towns.
Some of their videos are quite fascinating, illustrating the forces behind some of earth’s natural erosion processes. Check it out for yourself.
The bottom line on all of this is that the less the mining industry is mentioned in the Landslide Blog, the better it is.
Note: You can sign up for the KJK mailing list to get notified when new blogs are posted.
Share

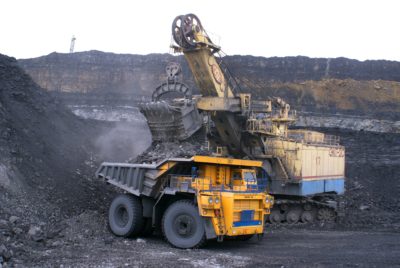
Remote Sensing of Ore Grades

mining automation
Update:  This blog was originally written in March 2016 and has been updated Jan 2019. 
The mining industry must continually find ways to improve and modernize. The most likely avenue for improvement will be using new technologies as they become available.
One of the players on the scene is a start-up company called “MineSense Technologies Ltd.”  They are a British Columbia company looking to improve ore extraction and recovery processes based on the sensing and sorting of low-grade ore. They hope their technology will improve mine economics by reducing the consumption of energy, water, and reagents.

Minesense

Having first written about this in 2016, its still not entirely clear to me how developed their technology is in 2019. Thus far they appear to be secretive with respect to their testing and performance results.  Certainly they are able to raise financing to keep them going.

Sensors are the answer

It appears MineSense is relying on a combination of ground-penetrating sensors with other technology in order to measure and report the grade of ore in real time.
Existing ore sorting technologies seem to focus on distinguishing mineralized material from gangue, but MineSense seems to be targeting using actual ore grades as the defining factor.
They hope to be able to eventually integrate their technology into equipment such as shovels, scooptrams, conveyors, feeders, and transfer chutes.
Their proprietary technology is based on High Frequency Electromagnetic Spectrometry and High Speed X-Ray Fluorescence sensors. Reportedly these can deliver better sensitivity and operate at high speeds. They plan to develop two distinct product lines; shovel-based systems; and conveyor belt-based systems.

ShovelSense

Their ShovelSense system would be a real-time mineral telemetry and decision system and used for measurement of ore quality while material is being scooped into the dipper, then reporting the ore quality and type to the grade control/ore routing system, and then enabling real-time online ore/waste dispatch decisions. Additional features may include tramp metal and missing tooth detection.  Sounds like a good idea, albeit some practical operating issues will need to be overcome.

BeltSense

Their belt conveyor systems (BeltSense) will use high-speed multi-channel sensing to characterize conveyed ore and waste in real time, allowing grades and tonnages to be reported and allowing ore to be diverted to correct destinations based on the sensor responses.
MineSense say that pilot units are operating at 20 tph and systems of up to 2000 tph are in the development stages.
Ore sorting has been around for a long time, with companies like Tomra, but possibly the MineSense technical approach will be different.

Conclusion

The bottom line is that we should all keep an eye on the continued development of this technology, especially as MineSense completes larger field trials.  Hopefully they will soon share results with industry since it will be critical for operators to see more actual case study data on their website.
I recognize that developing new technology will have its successes and failures. Setbacks should not be viewed as failure since innovation takes time. Hopefully after fine tuning their technology they can advance to the commercialization stage.
Note: If you would like to get notified when new blogs are posted, then sign up on the KJK mailing list on the website.  Otherwise I post notices on LinkedIn, so follow me at: https://www.linkedin.com/in/kenkuchling/.
Share

Higher Metal Prices – Should Miners Lower the Cut-Off Grade?

When metals prices are high, we are generally told that we should lower the cutoff grade. Our cutoff grade versus metal price formula tells us this is the correct thing do. Our grade-tonnage curve reaffirms this since we will now have more metal in the mineral reserve.

But is lowering the cutoff grade the right thing?

Books have been written on the subject of cutoff grades where readers can get all kinds of detailed logic and calculations using Greek symbols (F = δV* − dV*/dT). Here is one well known book by Ken Lane, available on Amazon HERE.
Recently we have seen a trend of higher cash costs at operating mines when commodity prices are high. Why is this?
It may be due to higher cost operating inputs due to increasing labour rates or supplies. It may also be partly due to the lowering of cutoff grades.  This lowers the head grade, which then requires more tonnes to be milled to produce the same quantity of metal.
A mining construction manager once said to me that he never understood us mining guys who lower the cutoff grade when gold prices increase. His concern was that since the plant throughput rate is fixed, when gold prices are high we suddenly decide to lower the head grade and produce fewer and higher cost ounces of gold.

Do the opposite

His point was that we should do the opposite.  When prices are high, we should produce more ounces of gold, not fewer. In essence, periods when supply is low (or demand is high) may not be the right time to further cut  supply by lowering head grades.
Now this is the point where the grade-tonnage curve comes into play.
Certainly one can lower the cutoff grade, lower the head grade and produce fewer ounces of gold.  The upside being an extension in the mine life.  A company can report more ounces in reserves and perhaps the overall image of the company looks better (if it is being valued on reserves).   To read more about the value of grade-tonnage curves, you check out this blog post “Grade-Tonnage Curves – Worthy of a Good Look.

What if metal prices drop back?

The problem is that there is no guarantee that metal prices will remain where they are and the new lower cutoff grade will remain where it is. If the metal prices drop back down, the cutoff grade will be increased and the mineral reserve will revert back to where it was. All that was really done was accept a year of lower metal production for no real long term benefit.
This trade-off  contrasts a short term vision (i.e. maximizing annual production) against a long term vision (i.e. extending mineral reserves).

Conclusion

The bottom line is that there is no simple answer on what to do with the cutoff grades.  Hence there is a need to write books about it.
Different companies have different corporate objectives and each mining project will be unique with regards to the impacts of cutoff grade changes on the orebody.
I would like to caution that one should be mindful when plugging in new metal prices, and then running off to the mine operations department with the new cutoff grade. One should fully understand both the long term and short term impacts of that decision.
In another blog post on the cutoff grade issue, I discuss whether in poly-metallic deposits the cutoff should be based on metal equivalent or block NSR value.  Neither approach is perfect, but I prefer the NSR option.  You can read that post at “Metal Equivalent Grade versus NSR for Poly-Metallics“.


Note: If you would like to get notified when new blogs are posted, then sign up on the KJK mailing list on the website.  Otherwise I post notices on LinkedIn, so follow me at: https://www.linkedin.com/in/kenkuchling/.
Share

Mining Fads and the Herd Mentality

minerals
After having worked in the mining industry for over 40 years, it is interesting to experience the herd mentality that exists.  Its fascinating to see how easily the industry gets caught chasing the latest fads and loses focus on the long term picture.
All it takes is a short term spike in a certain commodity price, or a big discovery somewhere, and then off goes  the herd in that direction.  It doesn’t matter the rationale driving the event, companies just know they need to be in there.   Investors also know they need to be in there.  Its classic FOMO; the fear of missing out.
These fad events, or crazes, can be based on certain commodities, jurisdictions, or technologies. The mining industry is flexible.  Here are a few examples that I have seen; you may have others in your own experience.

Commodity Fads

Often as soon as there is a price spike or positive market narrative,  commodity specific projects can take on a life of their own.  The following are few examples, and when you reflect back on them, how many actually were a success for more than but a few.
  • Potash: several years ago potash prices spiked and acquiring potash leases was the fad.  It didn’t matter where they were located around the globe, be it Canada, Russia, Ethiopia, Thailand, Brazil, etc.   BHP even jumped in with both feet.  The potash craze has largely fizzled out as prices returned to normal.  We may be seeing a resurgence these days but not to the same level as in the past.
  • Lithium / Graphite:  as soon as green battery technology started to be promoted in the news in 2016, miners couldn’t run fast enough to pick up the lithium properties.  The same held for battery metals such graphite, vanadium, cobalt, and also rare earth categories. That was 2016.   After a lull for a few years, the process restarted itself in 2022, although it seems the graphite – lithium excitement is now calming down in 2026.
  • Uranium: years ago uranium prices spiked and uranium properties were hot everywhere.  Prices have dropped but seem to be ramping up again in late 2018 and the commodity is still somewhat hot in 2026.
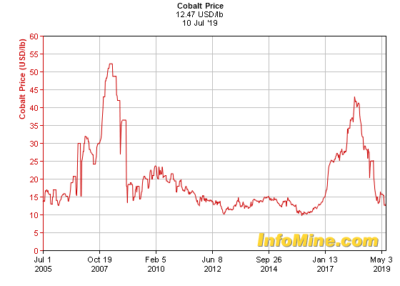
  • Cobalt Excitement Curve

    Cobalt: see the price chart on the right to see how cobalt went into a craze and then out of it.  Companies jumped into cobalt projects, then jumped out when the price dropped.
  • Nickel: years ago a spike in nickel prices caused a surge in nickel properties, whether it was sulphide nickel, laterite nickel, or other forms.  Lately in 2026 nickel is given some credit as battery metal, but not as hot as it was.
  • Iron Ore: in conjunction with the Chinese construction boom decades ago, iron ore properties were hot around the globe, whether in high cost or low cost jurisdictions, it didn’t matter where the property was.  Iron is still being pursued but its a lot quieter today in 2026.
  • Diamonds: in conjunction with the first diamond discoveries in Canada in the 1990’s, diamond properties became super hot, whether in the Canada or around the globe.  If you couldn’t get a property in Canada’s NWT boom area, places like Alberta, Sask, Ontario or anywhere globally was fine too.   The luster of diamonds seems to be gone now.
  • China in general: decades ago every base metal project was thought of as either a potential supplier to China or a potential acquisition for Chinese companies.  As long as it could meet Chinese investor interest the project was good.  That is not the norm now, but China is still seen as a potential  target for many junior miner liquidity events.
  • In mid 2026, it seems that everyone is starting to look at tungsten and rare earths.   We will see how this enfolds going forward.

Regional Exploration Fads

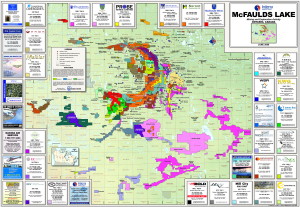
Mineral claim map exampleWe have all seen the staking rushes that occur when a world class prospect is discovered.  I’m sure we can all recall getting the large claim maps (as shown in Ring of Fire map) with their multicolored graphics showing the patchwork of acquisitions around a discovery. PDAC was great for distributing these.  They were well done and always interesting to study.
Picking up properties in hot areas (i.e. near-ology) became the fad and share prices would move upwards regardless of whether there was any favorable geology on the property, as long as it was in the region and made it onto the colorful map.  Who recalls the following?
  • Voisey’s Bay: with a mad staking rush around Newfoundland, with nothing else really paying off in the long run.
  • Saskatchewan:  the potash staking rush where almost every inch of the potash zone was staked with only a couple of companies eventually moving forward and only one or two going into production.
  • Indonesia: during Bre-X people could not acquire properties in Indonesia fast enough.
  • NWT:  where the diamond property staking rush was crazy in the mid 1990’s.
  • BC Golden Triangle: where this seems to have been the hot area for the last few years.
Have I missed any areas that you see as hot?

Mining Technology Fads

Even mining or processing technologies could get caught up in somewhat of a wave and move the herd.  Sometimes it was driven by suppliers or consultants. For the engineers out there, who can recall…
  • Paste Tailings: with numerous conferences and consultants promoting thickened or paste tailings technology as the panacea.  This lead to numerous studies related to thickening, pumping, and disposal at each mine.  The paste fad has now ended as companies moved toward filtered tailings instead.
  • Block Caving: whereby in order to deliver high tonnages at low cost, bulk underground mining was being promoted.  Everyone wanted their underground project to be a low cost caving style operation.  This block cave concept is still in play today, but higher metal prices may make conventional open pits a bit more economic.
  • High Pressure Grinding Rolls (HPGR): where process consultants would highlight HPGR as the new replacement for conventional grinding mills.  I’m not sure this technology has taken the industry by storm as they were hoping in the 1990’s.
  • IPCC: whereby inpit crushing and conveying systems were being promoted in many articles and global conferences as the solution to operating cost issues.  I think implementation of IPCC technology isn’t as simple as envisioned and I’m not aware of many cases of its successful implementation.
  • Dot.com: in the early 2000’s many junior miners left exploration behind and transitioned to the dot.com boom, a fad that essentially went nowhere for most.
  • Pre-concentration: this seems to be a growing technology that may be gaining momentum.  It isn’t new technology and it will definitely have its benefits.  However a big stumbling block is how many deposits are actually suitable for its application.  I have written more about this technology “Pre-Concentration – Savior or Not?
  • Stochastic Modelling: many proponents are pushing towards the use of probabilities in mine planning.  Its still the early stage here, so we will see if this gains traction.  The herd is not running in this direction .. yet.
  • AI:  The use of AI to summarize reports, compile, and analyze data is now being promoted by several online platforms.  As the previous example, we will see if this gains traction since the herd are not chasing this yet.
Have I missed any that you see as growing trends?


Conclusion

The bottom line is that over the years it has been interesting to watch the mining industry react to events.  Sometimes it seems like we’re passengers on a ship, almost capsizing due to the industry running from one side to other side and then back again.  Unfortunately that doesn’t necessarily make for smooth sailing.
What’s the next fad going to be? I don’t know … but if you can predict it, you can probably make a lot of money.
Note: You can sign up for the KJK mailing list to get notified when new blogs are posted. Follow me on Twitter at @KJKLtd for updates and other mining posts. The entire blog post library can be found at https://kuchling.com/library/
For some free mining calculator apps, including project timelines and a simplified cashflow modeller, check out this website https://sites.google.com/view/drillingdown

Share

Measured vs. Indicated Resources – Do We Treat Them the Same?

measured and indicated
One of the first things we normally look at when examining a resource estimate is how much of the resource is classified as Measured or Indicated (“M+I”) compared to the Inferred tonnage.  It is important to understand the uncertainty in the estimate and how much the Inferred proportion contributes.   Having said that, I think we tend to focus less on the split between the Measured and Indicated tonnages.

Inferred resources have a role

We are all aware of the regulatory limitations imposed by Inferred resources in mining studies.  They are speculative in nature and hence cannot be used in the economic models for pre-feasibility and feasibility studies. However Inferred resource can be used for production planing in a Preliminary Economic Assessment (“PEA”).
Inferred resources are so speculative that one cannot legally add them to the Measure and Indicated tonnages in a resource statement (although that is what everyone does).   I don’t really understand the concern with a mineral resource statement if it includes a row that adds M+I tonnage with Inferred tonnes, as long as everything is transparent.
When a PEA mining schedule is developed, the three resource classifications can be combined into a single tonnage value.  However in the resource statement the M+I+I cannot be totaled.  A bit contradictory.

Are Measured resources important?

It appears to me that companies are more interested in what resource tonnage meets the M+I threshold but are not as concerned about the tonnage split between Measured and Indicated.  It seems that M+I are largely being viewed the same.  Since both Measured and Indicated resources can be used in a feasibility economic analysis, does it matter if the tonnage is 100% Measured (Proven) or 100% Indicated (Probable)?
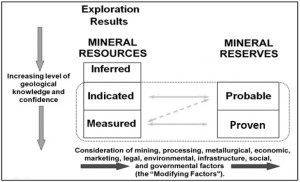
The NI 43-101 and CIM guidelines provide definitions for Measured and Indicated resources but do not specify any different treatment like they do for the Inferred resources.
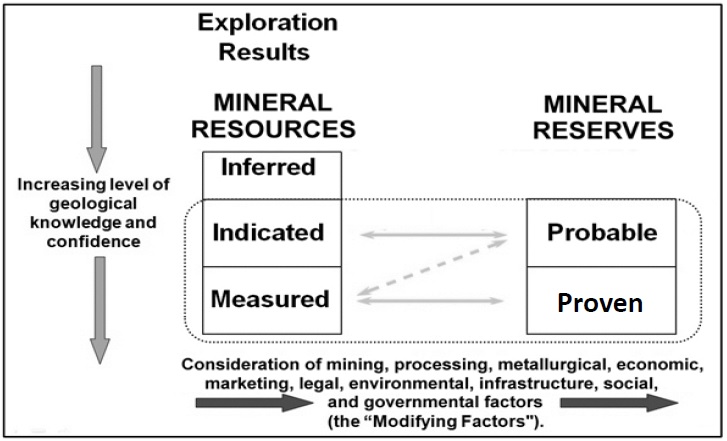
CIM Resources to Mineral Reserves

Relationship between Mineral Reserves and Mineral Resources (CIM Definition Standards).

Payback Period and Measured Resource

In my past experience with feasibility studies, some people applied a  rule-of-thumb that the majority of the tonnage mined during the payback period must consist of Measure resource (i.e. Proven reserve).
The goal was to reduce project risk by ensuring the production tonnage providing the capital recovery is based on the resource with the highest certainty.
Generally I do not see this requirement used often, although I am not aware of what everyone is doing in every study.   I realize there is a cost, and possibly a significant cost, to convert Indicated resource to Measured so there may be some hesitation in this approach. Hence it seems to be simpler for everyone to view the Measured and Indicated tonnages the same way.

Conclusion

NI 43-101 specifies how the Inferred resource can and cannot be utilized.  Is it a matter of time before the regulators start specifying how Measured and Indicated resources must be used?  There is some potential merit to this idea, however adding more regulation (and cost) to an already burdened industry would not be helpful.
Perhaps in the interest of transparency, feasibility studies should add two new rows to the bottom of the production schedule. These rows would show how the annual processing tonnages are split between Proven and Probable reserves. This enables one to can get a sense of the resource risk in the early years of the project.  Given the mining software available today, it isn’t hard to provide this additional detail.
Note: If you would like to get notified when new blogs are posted, then sign up on the KJK mailing list on the website.  Otherwise I post notices on LinkedIn, so follow me at: https://www.linkedin.com/in/kenkuchling/.
Share

3D Model Printing – Who To Contact?

One of the technologies that is still getting a lot of press is 3D printing.  It seems new articles appear daily describing some fresh and novel use. Everything from home construction, food preparation, medical supplies, and industrial applications, 3D printing continues to find new applications in a wide range of disciplines.

Mining can take advantage of 3D printing

In a previous blog “3D Printing – A Simple Idea”, I discussed the helpfulness of printing 3D topographic models for the team members of a mining study. I was recently contacted by a consulting firm in Texas that specializes in printing 3D mining models. Here is their story and a few model images as provided to me by Matt Blattman of Blattman Brothers Consulting. (www.blattbros.com/3dprinting)

Blattman Brothers Consulting

Their 3D printed models are used in the same way geologists and mining engineers have employed models for decades. In the past we saw the physical models made of stacked mylar or plexi-glass maps, wood or foam core. We recognized that there is value in taking two dimensional sections or plan maps and making a 3D representation.  This provides more information than those viewed on a computer screen.
Physical models convey scale, interactions and scope in ways that no other method can. Technology like 3D printing improves the model-making process by allowing the addition of high def orthophotos, reducing the model cost, increasing its precision and delivery time.
Currently 3D models can be made in a variety of materials, but the primary three are extruded plastic, gypsum powder, or acrylics.
  • Plastic models (ABS or PLA) are cheap, fast and can created on relatively inexpensive, hobbyist printers. The downside to these models is that the number of colors available in a single model are limited, typically a single color.
  • Powder-based printers can typically print in 6.5M colors, allowing for vibrant, photo-realistic colors and infinite choices for title blocks, logos and artistic techniques. However, gypsum models can be as fragile as porcelain and require some care in handling.
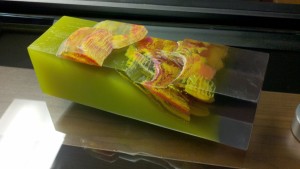
  • Acrylic models allow for translucent printing (“looking into the ground to see the geological structure”) and are more durable than the gypsum. Nevertheless, acrylic models are significantly more expensive than the other two types and the color palettes are limited.
Here are some examples.
Leapfrog Model

Leapfrog Model

Geological Model in Acrylic

Acrylic Model

Powder Based 3D Model

Powder Based 3D Model

Powder Based 3D Model

Powder Based 3D Model

Besides having another toy on your desk beside your stress ball, why not print off your mine plan, or print the geology shapes and topography? It’s all about communicating highly technical data to a non-technical audience, whether that audience is a permitting authority, the general public, or maybe even company management.
The ability to grasp a map or technical drawing is a learned skill and not everyone has it. If you’ve just spent $20M on a feasibility study, why assume that the attendees in a public meeting will fully appreciate the scale and overall impact of your proposed project with 2D maps?
That message can be better conveyed with a model that is easily understood. One of Blattman’s clients, Luck Stone, recently described how they use their 3D printed models in this video.

Blattman’s models are created from the same 3D digital data already in use by most companies involved in geological modeling and mine design. Other than the units (meters versus millimeters), the triangulated surfaces created by the software are no different than those created by mechanical or artistic 3D modeling programs.
While many 3D printing services are available on the market, not all of them are able to speak “mining”. They may not be able to walk the skilled geologist or mining engineer through the process of creating the necessary digital formats and that’s where Blattman comes in. With more than 20 years of mining experience and having already gone through the 3D printing learning curve, they can assist any natural resource company through the process, either as a full-service/turn-key project or just to advise the client on how to prepare their own files.

Conclusion

The bottom line is that 3D printing is here to stay and its getting better each year.   Go ahead and check out the technology to see if it can advance your path forward .
We would be interested in hearing about any experiences your have had with 3D modelling, pro’s and con’s.
Note: You can sign up for the KJK mailing list to get notified when new blogs are posted.
Share