Articles tagged with: Feasibility Study

Global Risks – Our Fears Are Evolving

Recently I wrote a blog about how the adoption of new technology in the mining industry will increase the risk of cyber crime. However this is just one of many risks the industry faces today.  This raises the question as to what are the main risks impacting all global businesses.  Luckily for us, the World Economic Forum undertakes an annual survey on exactly this subject.
Each year business leaders are queried about what they view as their major risks. The survey results are summarized in the Global Risk Report.
The 2019 report can be downloaded at this link. http://www3.weforum.org/docs/WEF_Global_Risks_Report_2019.pdf.
The study rates risks according to the categories “likelihood” and “impact”. A risk could have a high likelihood of occurring but have a low economic impact. One might not lose sleep over these ones.
Another interesting feature in the report is seeing how the top risks change from year to year.  Some risks from 10 years ago are no longer viewed as key risks today.

2019 risk situation

In 2019 environmental related risks dominate the survey results. They account for 4 of the top 5 risks by “impact” and 3 of the top 5 by “likelihood”. Technology related concerns about data fraud and cyber-attacks were also viewed as highly likely (#4 and #5). See the image below for the top 5 risks in each category.
Although the Global Risk survey wasn’t specifically directed at the mining industry, all of the identified risks do pertain to mining.


10 year risk trend

It is also interesting to look at the detailed 10 year  table in the report to see how the risk perceptions have changed over the last decade.
None of the top five “Impact” risks from ten years ago are still in the top five now and only two from 2014 still exist. In the “likelihood” category, a similar situation exists.
It will be interesting to compare the 2024 list with 2019 list to see how risks will continue to evolve.

How about the mining industry

EY Global Mining & Metals also undertake a risk survey, focused on mining only. You can read their article at this link “The Top Risks Facing Mining and Metals”.  Their top 10 risks are listed below, many are different than those from the World Economic Forum ranks. You must read the EY article to fully understand the details around their risk items.
  1. License to operate (difficulty to acquire)
  2. Digital effectiveness (lack thereof)
  3. Maximizing portfolio returns (can this be done)
  4. Cyber security (increasing risk of attack)
  5. Rising costs (can costs be controlled)
  6. Energy mix (acceptable power sources)
  7. Future of workforce (lack of interest in the sector)
  8. Disruption (falling behind competitors)
  9. Fraud (increasing sophistication)
  10. New world commodities (versus reduced demand for some commodities)

Conclusion

My bottom line is that the Global Risk Report is something that we should all read. Download it and then compare with what your company sees as its greatest risks. The only way to mitigate your risks is to know what they are.  The only way to work with others is to know what their issues are.
Note: If you would like to get notified when new blogs are posted, then sign up on the KJK mailing list on the website.  Otherwise I post notices on LinkedIn, so follow me at: https://www.linkedin.com/in/kenkuchling/.
Share

Flawed Mining Projects – No Such Thing as Perfection

Recently I read a post on LinkedIn where somebody was asking what key metrics companies are looking for in order to develop (or provide financing to) a new mining project. It’s more than just a project having a good NPV or IRR.  They are also looking at how difficult it is to achieve the targeted NPV.
Mining companies are always on the hunt for new projects to grow their cashflows. They would all like to find the “perfect” project; one with ideal conditions and great attributes.
However those perfect projects likely don’t exist anymore, if they ever even did.
Consequently companies must be willing to accept some potential flaws (or risks) in their go-forward projects.
The question is what flaws are they willing to accept and how far away from the ideal situation are they willing to go.

What makes a perfect project?

If one could envision a perfect mining project, what might it look like?   Here are some attributes that one would want to see (in random order). If a project had 100% of these, it would be a fantastic project.
    • A high grade ore orebody
    • A large reserve and long mine life to ride out commodity price cycles
    • Low operating cost
    • Low cash cost, in the bottom quartile of costs
    • Well defined ore zones, allowing simple mining with low dilution
    • A geotechnically competent rock mass
    • Clean and straightforward metallurgy
    • Consistent and straightforward permitting regulations
    • A stable government and stable fiscal regime
    • Safe security conditions for site personnel
    • High NPV and high IRR
    • No acid runoff issues from waste products
    • Stable tailings disposal conditions
    • Readily available local workforce / local power supply / good water supply
    • Favorable local community and stakeholder support
Other readers may have more attributes that they would like to see if asked to theorize “What constitutes a perfect mining project?”

Take off the promoter hat
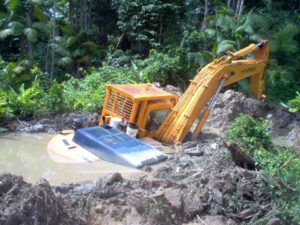
backhoe on soft claysNow take an honest look at some recent (or past) projects that you have been involved with. How many of the perfect attributes listed above would be represented? It would be surprising to see them all checked off. Unfortunately that means certain flaws (risks) must be accepted when developing a project.
Each company (or financier) will have their vision as to which attributes are “must have” and which ones are “nice to have”.

But we have risk tools

There are many risk tools available to help in evaluating the potential flaws in a project. Unfortunately these tools don’t make the decisions for management.
Risk based Monte Carlo analysis requires management to pre-define the magnitude of the risks and then decide upon what probability of success is acceptable. Real option analysis or decision trees or Kepner-Tregoe are examples of other tools that can help in the decision making process.
Ultimately risk is risky.  Management must make the go/no-go decision regardless of how many probabilistic histograms and tables they have generated. A 90% chance of success still means there is a 10% chance of failure. The probability of failure may be low, but it is not zero.
It would be interesting to examine recent failed projects to define the cause(s) of failure. One could then see if the cause was something that was pre-determined as a risk, either as a small risk or a large risk. Perhaps the cause was something that management felt could be mitigated or perhaps it was something viewed as highly unlikely. No doubt that successful projects also had risks, which were either mitigated or which (luckily) never occurred.

Conclusion

The bottom line is that management understandably have a difficult task in making go/no-go decisions. Financial institutions have similar dilemmas when deciding on whether or not to finance a project.

In my career I have sat in on such management discussions and it’s never been a simple process, mainly because no project is perfect. Management know all the flaws (at least they think they do) and thus have to decide whether to push forward knowing the flaws exist.
I fully expect that future mining project risk will increase due to the complexity of project designs and broadening of stakeholder dynamics. Hence decision making in the mining industry isn’t going to get any easier regardless of the decision tools being used.  Look at your own situation, are your projects getting easier or harder?
One should examine the impact of the project flaws on the project economics.  The most common way to do this is the sensitivity chart (i.e. spider graph).  However this itself is a flawed way to evaluate the flaws.  You can read why at this blog post “Mining Cashflow Sensitivity Analyses – Be Careful“.
A better approach is to use a probabalistic analysis, like Monte Carlo simulation, that can examine multiple factors at the same time.   I discuss the benefits of this approach in a blog post ” Mining Financial Modeling – Make it Better!
Note: If you would like to get notified when new blogs are posted, then sign up on the KJK mailing list on the website.  Otherwise I post notices on LinkedIn, so follow me at: https://www.linkedin.com/in/kenkuchling/.
Share

Mining Due Diligence Checklist

It doesn’t matter how long you have worked in the mining industry, at some point you will probably take part in a due diligence review. You might have been asked to help create a data room. Perhaps your company is looking at a potential acquisition. Maybe you’re a consultant with a particular expertise needed by a due diligence team. It’s likely that due diligence has impacted on many of us at some point in our careers.
The scope of a due diligence can be exceptionally wide. There are legal, marketing, and environmental aspects as well as all the technical details associated with a mining project. The amount of information provided can be overwhelming.

Checklists are great

Checklists are great and can be very helpful in a due diligence review. A detailed technical scope checklist is a great way to make sure things don’t fall through the cracks. A checklist helps keep a team on the same page and clarifies individual roles and tasks. Checklists bring focus and minimize sidetracking down unnecessary paths.
Recognizing this, I have created a personal due diligence checklist for these exercises. A screen shot of it is shown below. The list is mainly tailored for an undeveloped mining project still at the study stage, but it still has over 230 items that might need to be considered.

Every mining due diligence is unique

Not all of the items in the checklist are required for each review. Maybe you’re only doing a high level study to gauge management’s interest in a project. Maybe you’re undertaking a detailed review for an actual acquisition or financing event. It’s up to you to create your own checklist and highlight which items need to be covered off. The more items added the less risk of missing something in the end.
You a create your own checklist but if you would like a copy of mine just email me at KJKLTD@rogers.com and let me know a bit about how you plan to use it (for my own curiosity). Specify if you would prefer the Excel or PDF versions.
Please let me know if you see any items missing or if you have any comments.

Due Diligence isn’t for everyone

Mining due diligence exercises can be interesting and great learning experiences, even for senior people that have seen it all. However they can also be mentally taxing due to the volumes of information that one must find, review, and comprehend, all in a short period of time.
Some people are better at due diligence than others. It helps if one has the ability to quickly develop an understanding of a project. It also helps to know what key things to look for, since many risks are common among projects.
Further on the topic of mining due diligence, I have a previous blog post triggered by my frustrations with some poorly set up data rooms.  You can read that at “Due Diligence Data Rooms – Help!”  My request is that when setting up a mining data room, please think about the people who will be using it.
Note: If you would like to get notified when new blogs are posted, then sign up on the KJK mailing list on the website.  Otherwise I post notices on LinkedIn, so follow me at: https://www.linkedin.com/in/kenkuchling/.
Share

Mining Dilution Prediction – Its Not That Simple

mining reserve estimation
Over my years of working on and reviewing mining studies, ore dilution often seems to be one of the much discussed issues.  It is deemed either too low or too high, too optimistic or too pessimistic.  Project economics can see significant impacts depending on what dilution factor is applied.  They are numerous instances where mines have been put into production, and excess dilution has subsequently led to their downfall.  Hence we need to take the time to think about what dilution is being applied and the basis for it.

Everyone has a preferred dilution method.

I have seen several different approaches for modelling and applying dilution.   It seems that engineers and geologists have their own personal favorites and tend to stick with them.   Here are some common dilution approaches that I have seen (and used myself).
1. Pick a Number:
This approach is quite simple.  Just pick a number that sounds appropriate for the orebody and the mining method.  There might not be any solid technical basis for the dilution value, but as long as it seems reasonable, it might go unchallenged.  Possibly its a dilution value commonly seen in numerous other studies.
2. SMU Compositing:
This approach takes each percent block (e.g.  a block is 20% waste and 80% ore) and mathematically composites it into a single Selective Mining Unit (“SMU”) block with an overall weighted average grade.  The SMU compositing approach will dilute the ore in the block with the contained waste.  Ultimately that might convert some highly diluted ore blocks to waste once a cutoff grade is applied.   Some engineers may apply an additional dilution percentage beyond the SMU compositing, while others will consider the blocks fully diluted at this step.
3. Diluting Envelope:
This approach assumes that a waste envelope surrounds the ore zone.  One estimates the volume of this envelope on different benches, assuming that it is mined with the ore.  The width of the waste envelope may be linked with the blast hole spacing used to define the ore and waste contacts for mining.  The diluting grade within the waste envelope can be estimated or one may simply assume a more conservative zero-diluting grade.   In this approach, the average dilution factor can be applied to the final production schedule to arrive at the diluted tonnages and grades sent to the process plant.
4. Diluted Block Model:
This dilution approach uses complex logic to look at individual blocks in the block model, determine how many waste contact sides each block has, and then mathematically applies dilution based on the number of contacts.  A block with waste on three sides would be more heavily diluted than a block with waste only on one side.   Usually this approach relies on a direct swap of ore with waste.  If a block gains 100 m3 of waste, it must then lose 100 m3 of ore to maintain the volume balance.   The production schedule derived from a “diluted” block model usually requires no subsequent dilution factor.
5. Using UG Stope Modelling
I have also heard about, but not yet used, a method of applying open pit dilution by adapting an underground stope
modelling tool.  By considering an SMU as a stope, automatic stope shape creators such as Datamine’s
Mineable Shape Optimiser (MSO) can be used to create wireframes for each mining unit over the entire
deposit. Using these wireframes, the model can be sub-blocked and assigned as either ‘ore’ (inside the
wireframe) or ‘waste’ (outside the wireframe) prior to optimization.   It is not entirely clear to me if this approach creates a diluted block model or generates a dilution factor to be applied afterwards.


When is the Cutoff Grade Applied?

Depending on which dilution approach is used, the cutoff grade will be applied either before or after dilution.   When the dilution approach requires adding dilution to the final production schedule, then the cutoff grade will have been applied to the undiluted material (#1 and #2).
When dilution is incorporated into the block model itself (#3 and #4), then the cutoff grade is likely applied to the diluted blocks.
The timing of when the cutoff grade is applied to the ore blocks will have an impact on the ore tonnes and had grade being reported.

Does one apply dilution in pit optimization?

Another occasion when dilution may be used is during pit optimization.  In the software, there are normally input fields for both a dilution factor and an ore loss factor.   Some engineers will apply dilution at this step while others will leave the factors at zero.  There are valid reasons for either approach.
My preference is use a zero dilution factor for optimization since the nature of the ore zones will be different at different revenue factors and hence dilution would be unique to each.   It would be good to verify the impact that the dilution factor has on your own pit optimization by running with a factor to see the result.

Conclusion

My personal experience is that, from a third party review perspective, reviewers tend to focus on the value of the  dilution percentage used and whether it seems reasonable.   The actual dilution approach tends to get less focus.
Regardless of which approach is being used, ensure that you can ultimately determine and quantify the percent dilution being applied.  This can be a bit more difficult with the mathematical block diluting approaches.
Readers may yet have different dilution methods in their toolbox and I it would be interesting to share them.
There is another blog post that discussed dilution from an underground mining perspective.  This discussion was written by another engineer who permitted me to share their paper.    You can read that at “Ore Dilution – An Underground Perspective“.
The entire blog post library can be found at this LINK with topics ranging from geotechnical, financial modelling, and junior mining investing.
Note: If you would like to get notified when new blogs are posted, then sign up on the KJK mailing list on the website.  
Share

Underground Feasibility Forecasts vs Actuals

underground costing
I recently attended a CIM Management and Economics Society presentation here in Toronto discussing the differences between actual underground production versus the forecast used in the feasibility study. The presenter was Paul Tim Whillans from Vancouver Canada.
His topic is interesting and relevant to today’s mining industry.  Paul raised many thoughtful points supported by data. He gave me permission to share his information.
The abstract for his paper is inerted below.  The paper can be downloaded at this LINK and here are the presentation slides.

ABSTRACT

An underground mining study that is done in accordance with NI43-101, JORC or similar reporting code is generally assumed by the public to be representative, independent and impartial. However, it has been well documented by academics and professionals in our industry that there is a sharp difference between the forecasts presented in these underground studies and the actual costs when a mine is put into production.
For underground mines, the risks associated with obtaining representative information are much greater than for surface mining and the cost of accessing underground ore is also proportionally much greater. There is a pressing need to align expectations, by improving the accuracy of projections. This will result in reduced risk to mining companies and investors and provide more reliable information to government agencies, the public, and more importantly, the communities in which the proposed mine will operate.
The objective of this article and an article currently being written titled “Mining Dilution and Mineral Losses” is to:
– Discuss the dynamics of intention that lead to over-optimism;
– Provide simple tools to identify which studies are likely to be more closely aligned with reality;
– Identify some specific points where underground mining studies are generally weak;
– Discuss practices currently in use in our industry that lead to a composite or aggregate effect of over optimism;
– Describe the effects of overly optimistic studies;
– Outline specific changes that are necessary to overcome these challenges; and
– Stimulate discussion and awareness that will lead to better standards.”

Conclusion

I agree with many of the points raised by Paul in his study. The mining industry has some credibility issues based on recent performance and therefore understanding the causes and then repairing that credibility will be important for the future.
Credibility ultimately impacts on shareholder returns, government returns, local community benefits, and worker health and safety; so having a well designed mine will realize benefits for many parties.
If you need more information Paul’s website is at http://www.whillansminestudies.com/
Note: You can sign up for the KJK mailing list to get notified when new blogs are posted.
Share

Ore Stockpiling – Why are we doing this again?

ore stockpile
In many of the past mining studies that I have worked, stockpiling strategies were discussed and usually implemented. However sometimes team members were surprised at the size of the stockpiles that were generated by the production plan. In some cases it was apparent that not all team members were clear on the purpose of  stockpiling or had preconceived ideas on the rationale behind it. To many stockpiling may seem like a good idea until they saw it in action.
Mine Stockpile
In this blog I won’t go into all the costs and environmental issues associated with stockpile operation.  The discussion focuses on the reasons for stockpiling and why stockpiles can get large in size or numerous in quantity.
In my experience there are four main reasons why ore stockpiling might be done. They are:
1. Campaigning: For metallurgical reasons if there are some ore types that can cause process difficulties if mixed  with other ores. The problematic ore might be stockpiled until sufficient inventory allows one to process that ore (i.e. campaign) through the mill. Such stockpiles will only grow as large as the operator allows them to grow. At any time the operator can process the material and deplete the stockpile. Be aware that mining operations might still be mining other ore types, then those ores may need to be stockpiled during the campaigning.  That means even more ore stockpiles at site.
2. Grade Optimization: This stockpiling approach is used in situations where the mine delivers more ore than is required by the plant, thereby allowing the best grades to be processed directly while lower grades are stockpiled for a future date. Possibly one or more grade stockpiles may be used, for example a low grade and a medium-low grade stockpile. Such stockpiles may not get processed for years, possibly until the mine is depleted or until the mined grades are lower than those in the stockpile. Such stockpiles can grow to enormous size if accumulated over many years.  Oxidation and processability may be a concern with long term stockpiles.
3. Surge Control: Surge piles may be used in cases where the mine may have a fluctuating ore delivery rate and on some days excess ore is produced while other days there is underproduction. The stockpile is simply used to make up the difference to the plant to provide a steady feed rate. These stockpiles are also available as short term emergency supply if for some reason the mine is shut down (e.g. extreme weather). In general such stockpiles may be relatively small in size since they are simply used for surge control.
4. Blending: Blending stockpiles may be used where a processing plant needs a certain quality of feed material with respect to head grade or contaminant ratios (silica, iron, etc.). Blending stockpiles enables the operator to ensure the plant feed quality to be within a consistent range. Such stockpiles may not be large individually; however there could be several of them depending on the nature of the orebody.
There may be other stockpiling strategies beyond the four listed above but those are the most common.

Test Stockpiling Strategies

Using today’s production scheduling software, one can test multiple stockpiling strategies by applying different cutoff grades or using multiple grade stockpiles. The scheduling software algorithms determine whether one should be adding to stockpile or reclaiming from it. The software will track grades in the stockpile and sometimes be able to model stockpile balances assuming reclaim by average grade, or first in-first out (FIFO), or last in-first out (LIFO).
ore stockpile
Stockpiling in most cases provides potential benefits to an operation and the project economics. Even if metallurgical blending or ore campaigning is not required, one should always test the project economics with a few grade stockpiling scenarios.
Unfortunately these are not simple to undertake when using a manual scheduling approach and so are a reason to move towards automated scheduling software.
Make sure everyone on the team understands the rationale for the stockpiling strategy and what the stockpiles might ultimately look like. They might be surprised.
Note: If you would like to get notified when new blogs are posted, then sign up on the KJK mailing list on the website.   Follow us on Twitter at @KJKLtd for updates and insights.
Share

Pre-Concentration – Savior or Not?

pre-concentration
Can pre-concentration become a savior for the mining industry by lowering metal production costs?
Pre-concentration is a way of reducing the quantity of ore requiring higher cost downstream processing, i.e. grinding in particular.  One can attain significant cost savings in energy consumption and operating expenses by using a low cost method to pre-concentrate minerals into a smaller volume. A previous blog “Remote Sensing of Ore Grades” discussed one new pre-concentration method currently under development.

Pre-concentration isn’t new

Pre-concentration has been around for many years.  However the techniques available are generally limited.  Hence many ore types are not amenable to it..unfortunately.
The main methods available are:
Ore sorting, which can be done using automated optical, electrical, or magnetic susceptibility sensors to separate ore particles from waste. The different sensors can rely on colour recognition, near infrared radiation, x-ray fluorescence, x-ray transmission, radiometric, or electromagnetic properties. The sensors can determine if a particle contains valuable mineral or waste, thereby sending a signal to activate air jets to deflect material into ore and waste bins.
Density separation, or specific gravity differences are another property that some pre-concentration methods can use. Gravity based systems such as dense media separation (DMS), jigs, or centrifugal concentrators are currently in commercial production.
Scrubbing, another very simple pre-concentration method is scrubbing, whereby simply separating fines or coatings may remove deleterious materials prior to final processing.   Blue Sky Uranium is a recent project that I was involved in where a simple scrubbing step resulted in 4-5 times increase in grade and volume reduction.

 BenefitsJig Plant 1

Pre-concentration provides several benefits:
  • If done underground or at satellite mine site, the ore hoisting or ore transport costs can be reduced.
  • If the pre-concentration rejects can be used as mine backfill, this can reduce backfilling costs.
  • Processing of higher grade pre-concentrated mill feed can reduce energy costs and ultimately reduce the cash cost of metal produced.
  • Grinding costs can be reduced if waste particles are harder than the ore particles and they can be scalped.
  • Minimizing waste through the process plant will reduce the quantity of fine tailings that must be disposed of.
  • Lowering operating costs may potentially allow lowering of the cutoff grade and increasing mineral reserves.
  • Higher head grades would increase metal production without needing an increase in plant throughput.

Limited ore types are suited for pre-concentration

Not all ore types are amenable to pre-concentration and therefore a rigorous testing program is required. In most cases a pre-con method is relatively obvious to metallurgical engineers but testing is still required to measure performance.
Testing is required to determine the waste rejection achieved without incurring significant ore loss. Generally one can produce a higher quality product if one is willing to reject more ore with the waste.  It becomes a trade-off of metal recovery versus processing cost savings.
Fine particles generated in the crushing stage might need to bypass the pre-con circuit. If this bypassed material is sent to downstream processing circuits, one may need to examine crushers that minimize fines to avoid excessive material bypassing the pre-con circuit.

Reject waste or reject ore?

One must decide if the pre-con system should reject waste particles from the material stream or reject ore particles from the stream.  The overall metal recovery and product quality may be impacted depending on which approach is used.

Conclusion

The bottom line is that the mining industry is continually looking for ways to improve costs and pre-concentration may be a great way to do this.   Every process plant design should take a look at it to see if is feasible for their ore type.
While the existing pre-concentration methods have their limitations, future technologies may bring in more ways to pre-concentrate.  This is probably an area where research dollars would be well spent.
Note: If you would like to get notified when new blogs are posted, then sign up on the KJK mailing list on the website.  Otherwise I post notices on LinkedIn, so follow me at: https://www.linkedin.com/in/kenkuchling/.
Share

Tailings Disposal Method Risk

mine tailings
After the Mt Polley and Samarco tailings failures, there have been ongoing discussions about the benefits of filtered (dry stack) tailings as the only way to eliminate the risk of catastrophic failure. Mining companies would all like to see risk reductions at their projects.

Filtered tailings stack

However what mining companies don’t like to see are the capital and operating costs associated with dry stacking.
The filtering cost and tailings transport cost are both higher than for conventional tailings disposal. Obviously this cost increase gets offset against improved environmental risk and simpler closure.

What should a mining company do?

In my experience, when designing a new mining project, all companies will complete a trade-off study for different tailings disposal methods and disposal sites. Contrary to some environmental narratives, mining companies really do want to know what are their tailings disposal options.  They would likely all adopt the dry stack approach if it was the most advantageous and least cost method.
The mining companies are fully aware of the benefits but the dilemma is the cost and being able to somehow justify the technology. Complicating their decision, companies also have other ways for reducing tailings risk.

The tailings decision gets complex.

In a tailings risk analysis, people will use a risk-weighting approach to assign an expected economic impact to their tailings plans. For example, if the cost of a failure is $200 million and the risk is 0.1%, then the Expected Cost is $200,000. The problem with this is its based on a theoretical calculation on an assumed likelihood of failure.
In reality either the dam will fail or it won’t.  So failure remediation money will be spent ($200M) or it won’t be spent ($ zero), it won’t be partially spent ($200k).
The accepted tailings risk therefore becomes a subjective factor.
While implementing a dry stack may reduce the risk of catastrophic failure to near zero, implementing a $100,000 per year monitoring program on a conventional tailings pond will reduce its risk to a degree.
Implementing a more expensive $500,000 per year monitoring program would reduce that risk even further.
Installing in a water treatment plant to enable periodic water releases may further lower the tailings risk.
The company can look at various mitigation options to keep lowering their risk, although none of the options would necessarily bring the risk down to zero. Ultimately the company could compare the various risk mitigation options against the dry stack costs in order to arrive at an optimal path forward.  At that point the costs for dry stack may be competative.

What level of risk is acceptable?

So the question ultimately becomes how low does one need to bring the tailings risk before it is acceptable to shareholders, regulators, and the public. I don’t think the answer is that one must lower the risk down to zero. There are not many things in today’s world that have zero risk. Driving a car, air travel, shipping oil by ocean tanker, having a gas furnace in your house.. none of these have zero risk yet we accept them as part of life.
Environmental groups continually discuss ways of forcing regulators and mining companies to take action against the risk of tailings failure. This is commendable.
However they generally fail to provide any guidance on what level of risk would be acceptable to them or to the public. It is difficult for these groups to actually define what an acceptable risk level is. They offer no solutions, other than its either zero risk or shut down all mining.

Conclusion

We know that mining is here to stay so we all should work together towards solutions.
The solutions need to be realistic in order to be taken seriously and to play a real role in redefining tailings disposal. Dry stack may not be the only solution and we should be looking for more ways to improve tailings disposal.
Since these other options don’t seem to be available yet, dry stack tends to offer the best solution in most circumstances.  I have written another blog on this topic where I suggest the industry just bite the bullett and go to dry stack in all new projects.  The trend appears to be going that way but no where near 100% acceptance.   You can read that post at this link  “Fluid Tailings – Time to Kick The Habit?”


Note: If you would like to get notified when new blogs are posted, then sign up on the KJK mailing list on the website.  Otherwise I post notices on LinkedIn, so follow me at: https://www.linkedin.com/in/kenkuchling/.
Share

Higher Metal Prices – Should Miners Lower the Cut-Off Grade?

When metals prices are high, we are generally told that we should lower the cutoff grade. Our cutoff grade versus metal price formula tells us this is the correct thing do. Our grade-tonnage curve reaffirms this since we will now have more metal in the mineral reserve.

But is lowering the cutoff grade the right thing?

Books have been written on the subject of cutoff grades where readers can get all kinds of detailed logic and calculations using Greek symbols (F = δV* − dV*/dT). Here is one well known book by Ken Lane, available on Amazon HERE.
Recently we have seen a trend of higher cash costs at operating mines when commodity prices are high. Why is this?
It may be due to higher cost operating inputs due to increasing labour rates or supplies. It may also be partly due to the lowering of cutoff grades.  This lowers the head grade, which then requires more tonnes to be milled to produce the same quantity of metal.
A mining construction manager once said to me that he never understood us mining guys who lower the cutoff grade when gold prices increase. His concern was that since the plant throughput rate is fixed, when gold prices are high we suddenly decide to lower the head grade and produce fewer and higher cost ounces of gold.

Do the opposite

His point was that we should do the opposite.  When prices are high, we should produce more ounces of gold, not fewer. In essence, periods when supply is low (or demand is high) may not be the right time to further cut  supply by lowering head grades.
Now this is the point where the grade-tonnage curve comes into play.
Certainly one can lower the cutoff grade, lower the head grade and produce fewer ounces of gold.  The upside being an extension in the mine life.  A company can report more ounces in reserves and perhaps the overall image of the company looks better (if it is being valued on reserves).   To read more about the value of grade-tonnage curves, you check out this blog post “Grade-Tonnage Curves – Worthy of a Good Look.

What if metal prices drop back?

The problem is that there is no guarantee that metal prices will remain where they are and the new lower cutoff grade will remain where it is. If the metal prices drop back down, the cutoff grade will be increased and the mineral reserve will revert back to where it was. All that was really done was accept a year of lower metal production for no real long term benefit.
This trade-off  contrasts a short term vision (i.e. maximizing annual production) against a long term vision (i.e. extending mineral reserves).

Conclusion

The bottom line is that there is no simple answer on what to do with the cutoff grades.  Hence there is a need to write books about it.
Different companies have different corporate objectives and each mining project will be unique with regards to the impacts of cutoff grade changes on the orebody.
I would like to caution that one should be mindful when plugging in new metal prices, and then running off to the mine operations department with the new cutoff grade. One should fully understand both the long term and short term impacts of that decision.
In another blog post on the cutoff grade issue, I discuss whether in poly-metallic deposits the cutoff should be based on metal equivalent or block NSR value.  Neither approach is perfect, but I prefer the NSR option.  You can read that post at “Metal Equivalent Grade versus NSR for Poly-Metallics“.


Note: If you would like to get notified when new blogs are posted, then sign up on the KJK mailing list on the website.  Otherwise I post notices on LinkedIn, so follow me at: https://www.linkedin.com/in/kenkuchling/.
Share

Global Tax Regimes – How Do They Compare?

mining economics
Update: This blog was originally written in Feb 2016, but has been updated in Aug 2019.
As a reminder for all QP’s doing economic analysis for PEA’s, don’t forget that one needs to present the economic results on an after-tax basis.
Every once in a while I still see PEA technical reports issued with only pre-tax financials.  That report is likely to get red- flagged by the securities regulators.  The company will need to amend their press release and technical report  to provide the after tax results.    No harm done other than some red faces.

Taxes can be complicated

When doing a tax calculation in your model, where can you find international tax information?  PWC has a very useful tax-related website.  The weblink below was sent to me by one of my industry colleagues and I thought it would be good to share it.
The PWC micro-site provides a host of tax and royalty information for selected countries.  The page is located at https://www.ey.com/gl/en/services/tax/global-tax-guide-archive
On the site they have a searchable database for tax information for specific countries.
The PWC tax and financial information includes topics such as:
  • Corporate tax rates
  • Excess profits taxes
  • Mineral taxes for different commodities
  • Mineral royalties
  • Rates of permissible amortization
  • VAT and other regulated payments
  • Export taxes
  • Withholding taxes
  • Fiscal stability agreements
  • Social contribution requirements
PWC has a great web site and hopefully they will keep the information up to date since tax changes happen constantly.  The website also has a guide related to the rules for the treatment of capital expenditures.   Check it out.  https://www.ey.com/gl/en/services/tax/global-tax-guide-archive
Note: If you would like to get notified when new blogs are posted, then sign up on the KJK mailing list on the website.  Otherwise I post notices on LinkedIn, so follow me at: https://www.linkedin.com/in/kenkuchling/.
Share