


 How long does it take to turn a mineral discovery into a producing mine. Also how long does permitting really take? These are questions that I see asked frequently in mining circles. The answer often thrown around is “18 years.” Is that really true or is it just a much-repeated industry myth?
Answering these questions is one reason we created a new online App called Timeline Viewer, hosted on the Drilling Down website (https://sites.google.com/view/drillingdown).
What Is the Timeline Viewer
The Timeline Viewer is a online application where anyone can take a look at the milestone history of selected mining projects. Key milestones are laid out chronologically from initial exploration, through studies, permitting, and sometimes even up to production.
The Viewer puts it all in one place: a visual, browsable record of what happened and when. This information is derived from corporate press releases, and weblinks are provided.
This App was vibe coded using the Zite platform (https://www.zite.com/). Just explain to the AI what you want to create, and it then writes all the code for you. Very simple to use and fast.
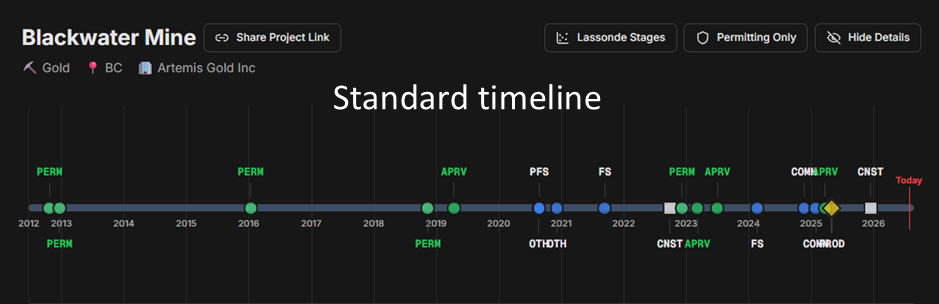
Let’s look at some Viewer output. The example below is the standard timeline view for the Brucejack Project in BC. One can see the sequence of activities that occurred over time as the mine moved into production. A details table (not shown) provides a brief description of each event. Hover over a point to see the details.
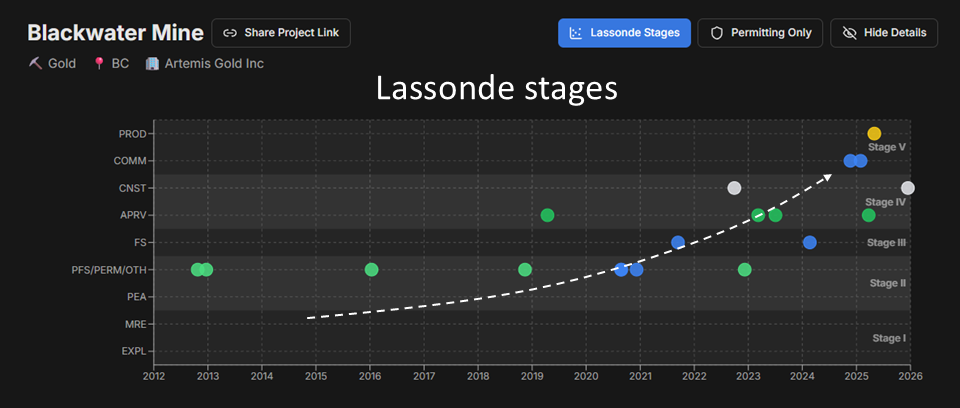
 An alternate way to examine the same timeline is to view the development progress in stages. In the Viewer app, we loosely use the term the “Lassonde Stages”, related to the Lassonde Curve (for more info). The Timeline Viewer lets you toggle on a view of the stages over time. Is it advancing towards production or flat lining at the same Stage.
For example, the image below shows the same Brucejack project with the Stages on the right side and milestones on the left axis. One can see the rapid rise as the project accelerates from exploration & studies (Stage II) to construction, commissioning, and production (Stage V). For comparison, the next image after Brucejack is the chart for the KSM Project. Do you notice any difference in the profile of the Stages?
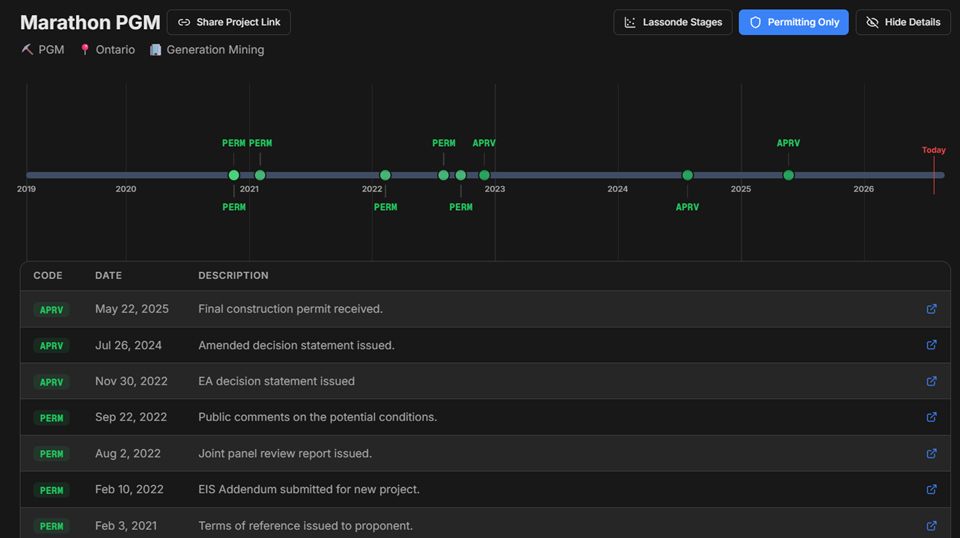
 The Viewer also allows one to see only the “permitting” events to focus on those. When was permitting initiated and when were approvals received? As an example, the timeline below is for the Generation Mining Marathon project, permitting activities only. They started the process in 2021 and received their federal final permit in 2025. The ball is in their court now.
Getting Started: The List of Projects
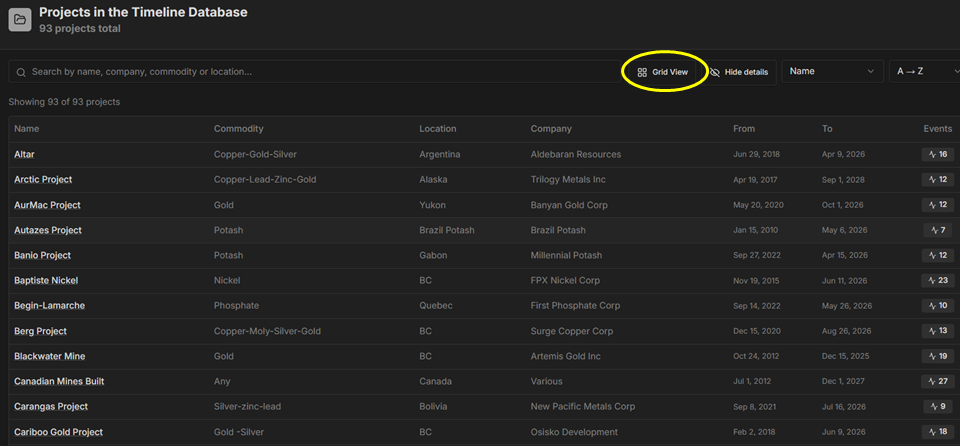
Before diving into an individual timelines, the obvious starting point is the List of Projects (https://jcrkyl7eju.zite.so/). This list gives you an overview of every project currently logged in the database (over 90 as of today).
You can browse the list in either Grid view or List view. Once you find a project of interest, clicking on it takes you to its timeline in the Viewer.
In the Viewer, (https://sites.google.com/view/drillingdown/timeline-viewer) you can trace the entire arc of a project’s development: when exploration drilling began, when a resource estimate was published, when studies (Preliminary Economic Assessment, Prefeasibility, Feasibility) were completed, when permits were approved, and when construction and commissioning eventually led to production. It’s a straightforward way to answer that “18 years” question for yourself, project by project.
Every milestone is categorized. The available categories cover the full lifecycle of a mining project: Exploration, Mineral Resource Estimate, Preliminary Economic Assessment, Prefeasibility Study, Feasibility Study, Permitting Activity, Permit Approval, Construction Start, Commissioning, Production, and a catch-all “Other” category for things like metallurgical testing, mergers, or partnerships that don’t fit neatly into the technical stages but are still significant to a project’s storyline.
All of the companies currently in the database (as of July 2026) are TSX listed. Many of their projects are in Canada, since government websites provide additional permitting timeline information as a backup. I noticed that some companies are much better at disclosing permitting steps than others. Its not often that I saw a company announce when public meetings were being held or when the public review period starts. I wonder why.
Why The Timeline Matters
For anyone following the mining sector, whether as an investor – analyst – geologist -engineer, the value of the Timeline Viewer is that it simplifies a series of press releases into a visual record.
You can look at different projects and start to notice patterns: which companies moved efficiently through permitting, which projects stalled for years at the exploration or pre-feasibility stage, and which ones sailed from discovery to production. Are there lifestyle companies out there in no hurry to get anywhere?
The Viewer is a tool for answering the “how long does it really take” question with actual information.
The Companion Piece: The Timeline Editor
The Timeline Viewer database is fed by a companion tool called the Timeline Editor, which is what allows the database to keep growing and stay current. The Editor is where the content gets compiled and maintained
If you’ve been following a specific project that isn’t in the database yet, you can add it yourself. Just send a message to KJKLTD@gmail.com to get access to the Editor. There is even a blank template available in Excel CSV format, so you can organize the project milestones on your own time and then upload them in the Editor.
One important thing to understand about this system is that it’s intended to be open source. Anyone who is given Editor access can modify a project’s timeline, which means there’s no absolute guarantee of accuracy on every entry. The information should be treated as crowdsourced rather than officially verified. Do not make investment decisions based on what you see here – this is for entertainment purposes only.
If you encounter a bug, issue or inaccuracy, please flag it by email (KJKLTD@gmail.com). We’re open to hearing comments, since nobody expects AI-written code to be 100% perfect.
Conclusion
 The Timeline Viewer is a simple tool for seeing how mining projects actually move (or don’t move) from discovery through to production. Over time as more projects get logged, the database becomes a richer resource for answering that original question honestly: does it really take 18 years to build a mine or how long does it take to permit? With enough timelines in the database, you can decide for yourself.
Note: You can sign up for the KJK mailing list to get notified when new blogs are posted. Follow me on Twitter at @KJKLtd for updates and other mining posts. The entire blog post library can be found at https://kuchling.com/library/
For some free mining calculator apps, including project timelines and a simplified cashflow modeller, check out this website https://sites.google.com/view/drillingdown
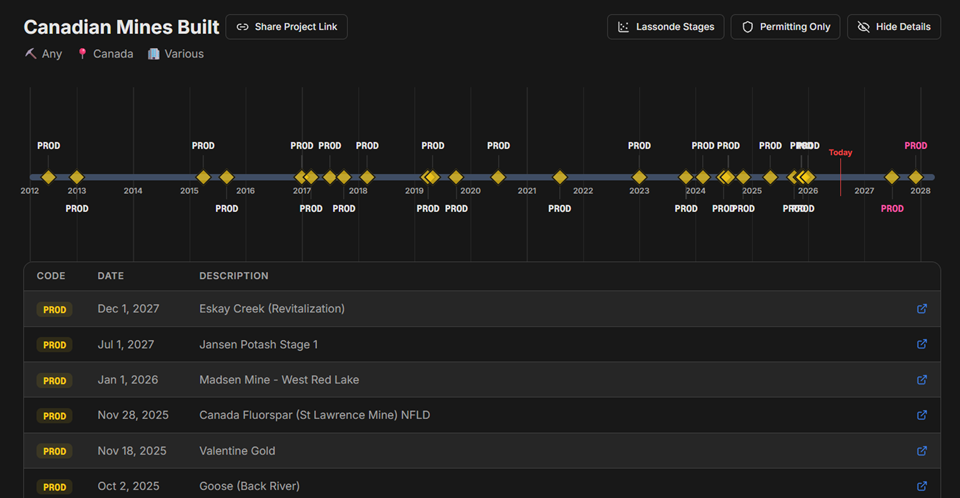
In closing, here is a summary timeline of all the mines coming into production in Canada over the last decade (from what I could find). The link to the timeline is https://neeovjtd7t.zite.so/project/3cd8bd8a-148f-4bc9-9bc3-fa56617f12d8

 Is the concept of optimization the most important factor in a project’s design? If so, which aspect is the most important to optimize? A danger is optimizing for a single criteria, for example NPV, at the expense of everything else. Selecting the optimal design for one aspect will likely result in being sub-optimal in some of the others.
 Optimization of a mining project can yield meaningful cost and efficiency gains. However mines face inherent constraints, such as ore grade variability, geological surprises, equipment life cycles, and regulatory issues.
 If one decides to pursue the path of operational flexibility, what are the things that help make it happen?
 Rather than focus on constant optimization in design, it may be wiser to focus on a flexible design. Adaptability, flexibility, and resilience may be more important than being fully optimized.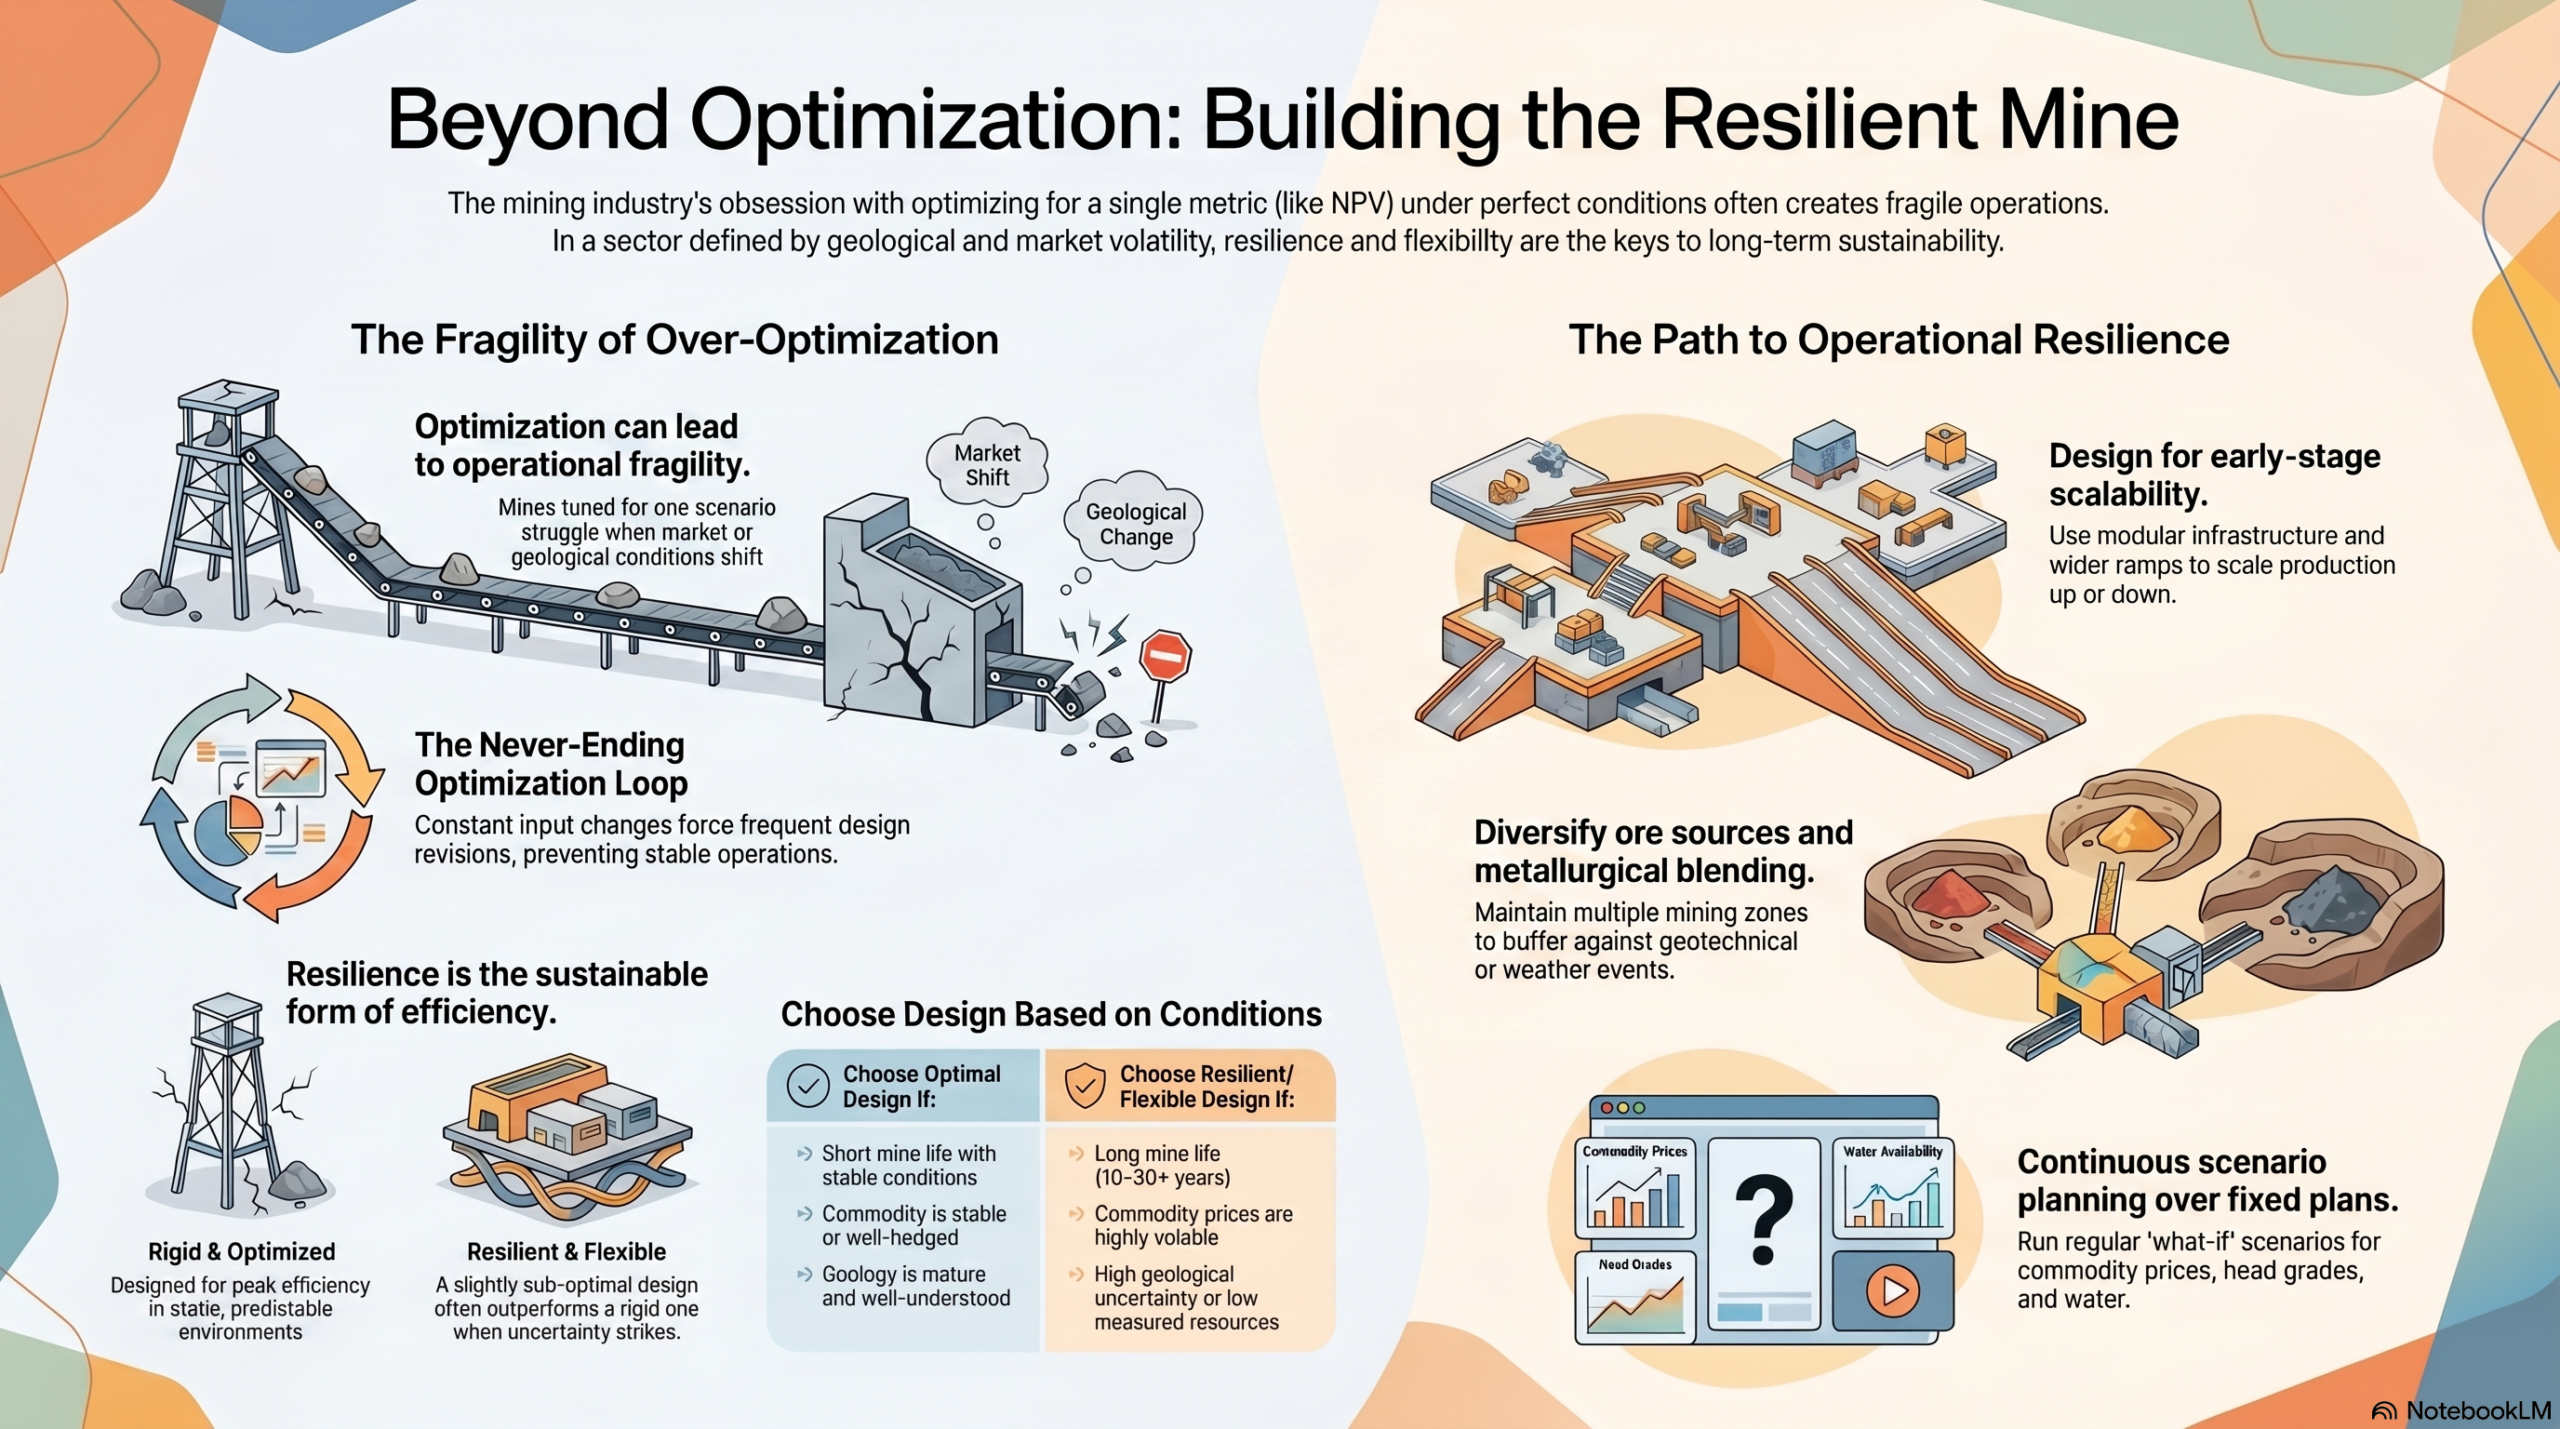

 I recently noticed a few new mining studies that relied on toll milling as their base case operation. This made me wonder if this is a trend and if there are more examples of where this is happening.
 USER PROMPT: What are the risks of toll milling plan.
 RESPONSE: The Qualified Person (QP) signing off on a technical study that uses toll milling as the base case carries significant professional and regulatory responsibility, particularly under NI 43-101 in Canada or JORC in Australia.
 The results given by Claude are quite thorough and insightful. It’s hard to argue with its observations and conclusions. This research took all of 30 seconds, so I can see it is no longer difficult to become a blog writer. Writing isn’t the challenge; finding interesting topics is.
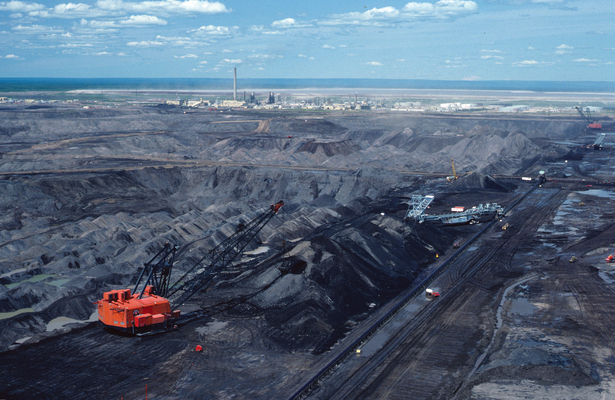
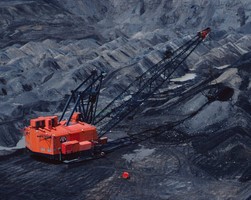 Syncrude had four large walking draglines, each with a 80 cubic metre bucket and 110 metre operating radius. These were very big machines; you could sit one in the end zone of a football field and the bucket would be digging (or dumping) in the other end zone. Two draglines were on the East side of the mine and two were on the West, mining the oilsand in 25 m wide strips.
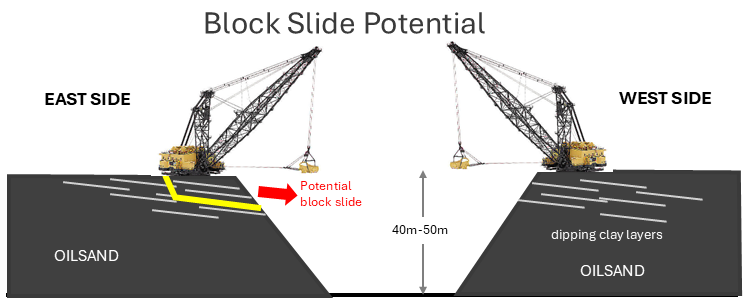 There were numerous instances of East mine block slides, where large portions of the upper slope would fail as large blocks, 50 metres long and up to 30 metres back from the crest. The fear was that if a dragline happened to be sitting on one of these failing blocks, the entire machine would slide along into the pit. Many block slides did occur over the years, but only a few came close to jeopardizing a machine. The geotechnical monitoring programs in place were successful (described later).
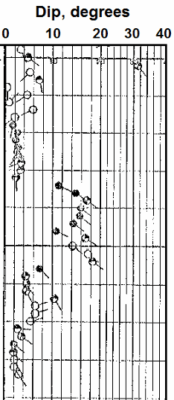 The insitu clay structures were identified using oil and gas borehole logging technology, with tadpole dipmeter plots (see image) used to analyse the bedding (the tail on the tadpole shows the dip direction). The vertical axis is depth from surface or elevation. The geotech engineers would use this information, combined with structural mapping of previously mined faces, to forecast potentially unstable areas.
 The main geotechnical issue on the West side were basal slope failures, termed this due to sliding along weak clays and muds at the base of the highwall. This photo shows a typical basal failure. Basal failures also occured on the East side.
 Once our engineer-in-training rotation program was complete, we were to be assigned to a more permanent position. For me, that was going to be as an East side geotechnical engineer – ugh!. It’s at that time I decided to look for greener pastures. Three years was long enough from 1980 to 1983; given the amount of learning and responsibility I had undertaken. Other colleagues left the same time, while many other friends stayed in Ft McMurray for their entire careers.
 In Part 1 of this two part blog post I would like to share some stories from the early days of my career working in Fort McMurray.
 At the time Syncrude had an excellent engineer-in-training program for new graduates. Every six months they would rotate engineers into different technical areas.
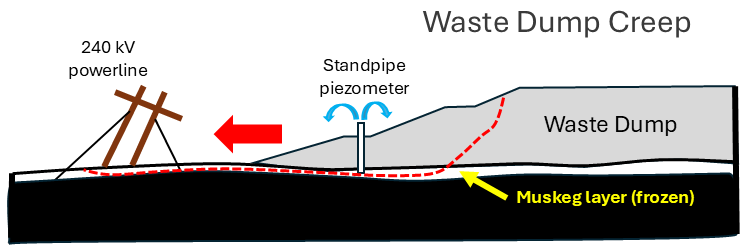 Next we sampled that depth carefully, revealing that frozen muskeg layers were present. When we installed standpipe piezometers in these holes, we saw water flowing out of the top of the pipes. This means the foundation pore pressure is high, way too high.
 For example, one project I had was to monitor the performance of different brands and styles of conveyor idlers. We would track about 2,000 individual idlers; when they were installed on the conveyors; when they were removed, why they were removed (bearing failure, cover failure, something else).
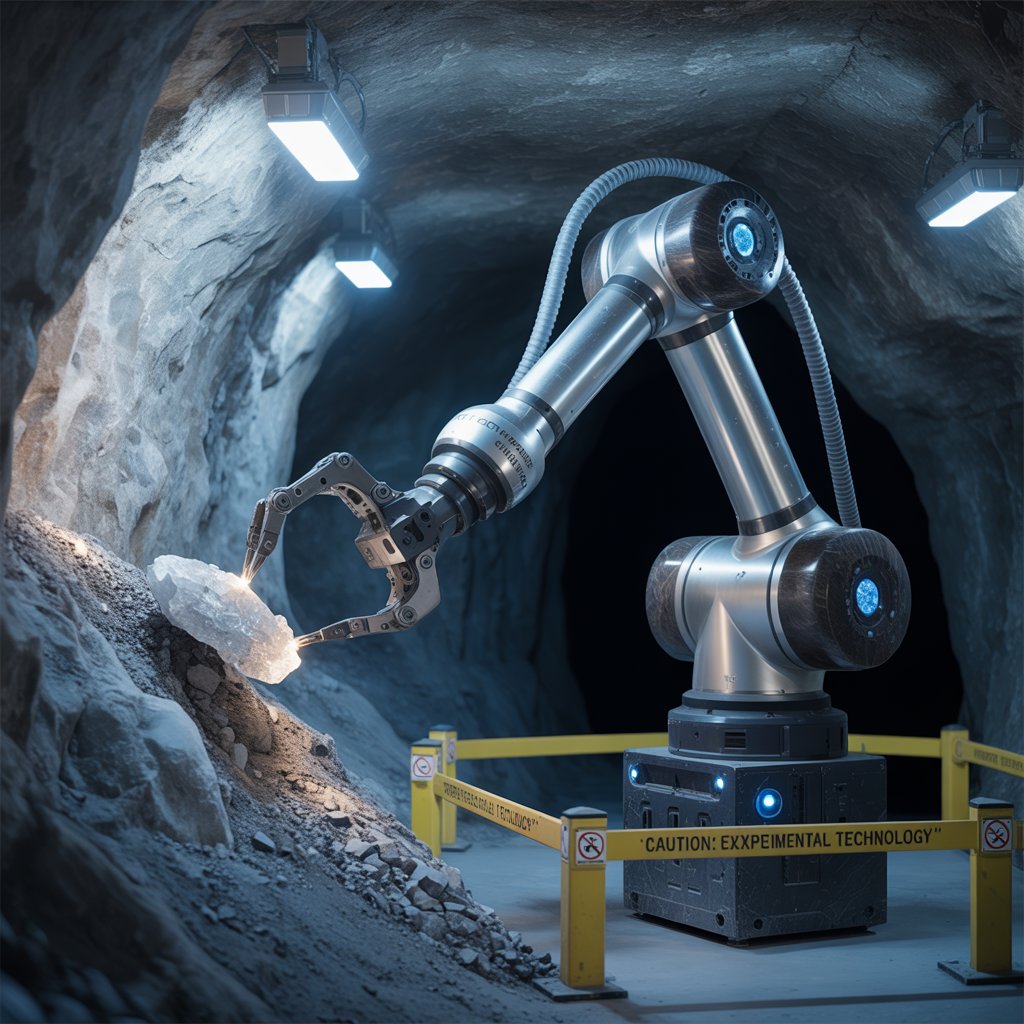 The mining industry is implementing more and more technology in the mining cycle.
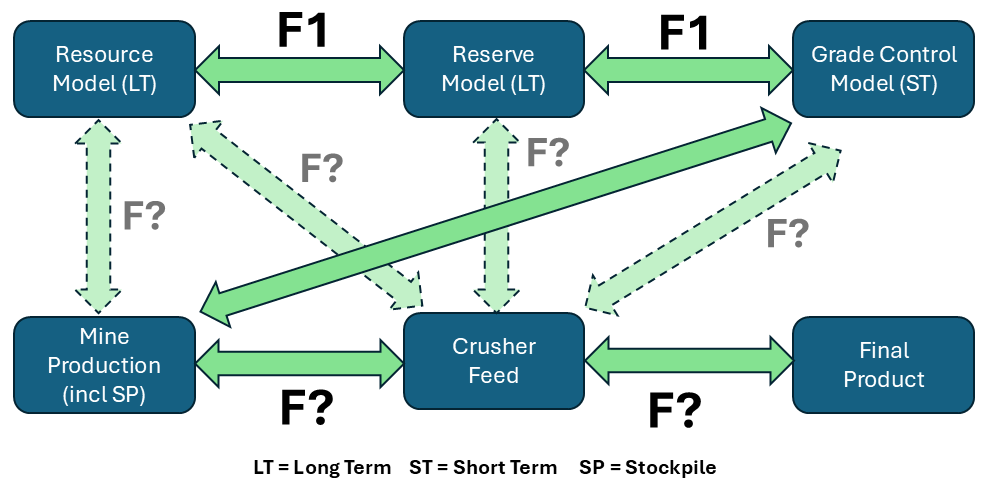 Mine reconciliation requires information such as initial predictions from exploration data and geological models, actual measurement: data from mining sources, such as blast holes, stockpile samples, or mill feed. As well it will need data on the final product being shipped off site. Do the metal quantities balance out throughout the mining operation?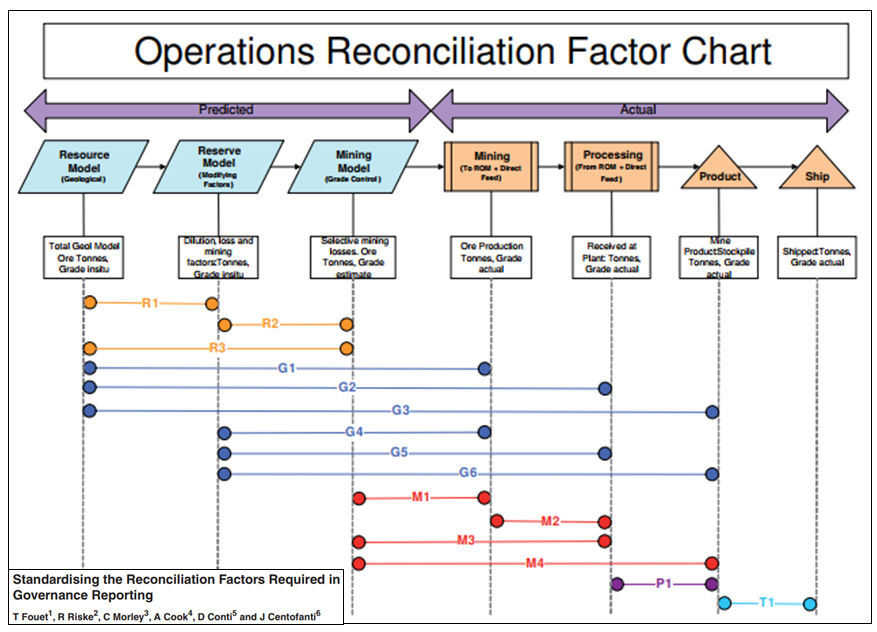
 Each mine site may be unique with respect to; ore sources; terminology; ore types; mining methods; stockpiling philosophy; processing methods; technology availability; and personnel capability. So often the easiest approach for mine reconciliation is based on the Excel spreadsheet. (Reconciliation is generally not an easy undertaking).

 There have been fairly recent heap leach pad failures in both the Yukon and Turkey and tailings dam failures in Chile and the Philippines. As a result I have been seeing more posts on LinkedIn about the application of satellite based InSAR deformation monitoring. I had never heard of InSAR before, so thought a little bit of background research on my part might be worthwhile. (Note: this article was written in 2024 and technological improvements are happening all the time).
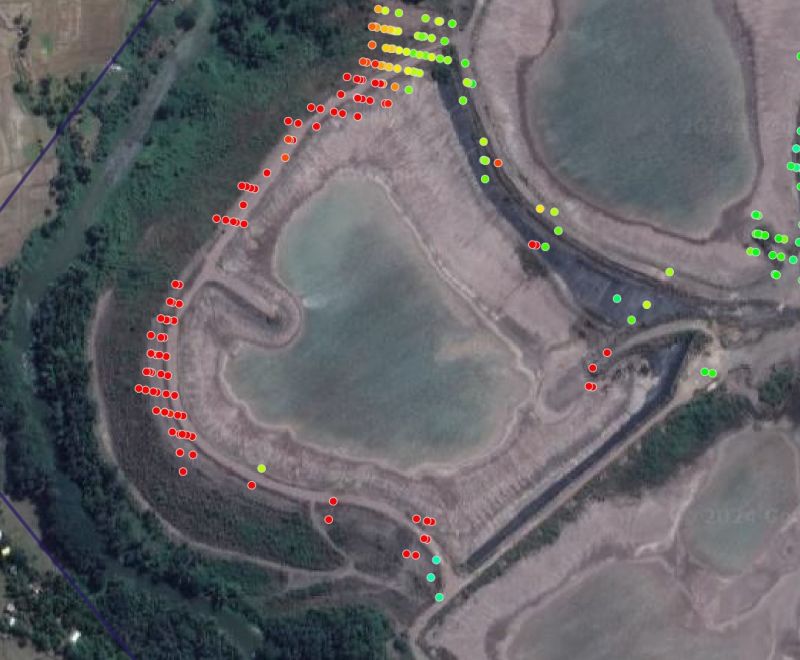 An example of a satellite being used is the Sentinel-1, launched in mid-2015 by the European Space Agency. This satellite information is open-source data. It will have a 6 to 12 day revisit cycle in many locations.
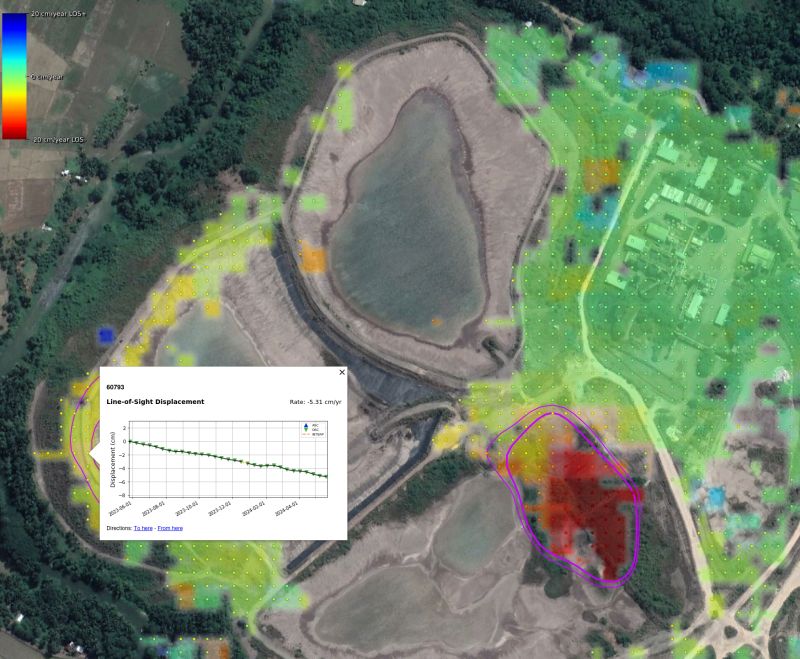 On LinkedIn, one can see numerous posts where independent experts are examining historical InSAR data for recent failures to see whether any early movement should have been detected. The results seem to be quite positive in that zones that have failed might have been red-flagged in advance.
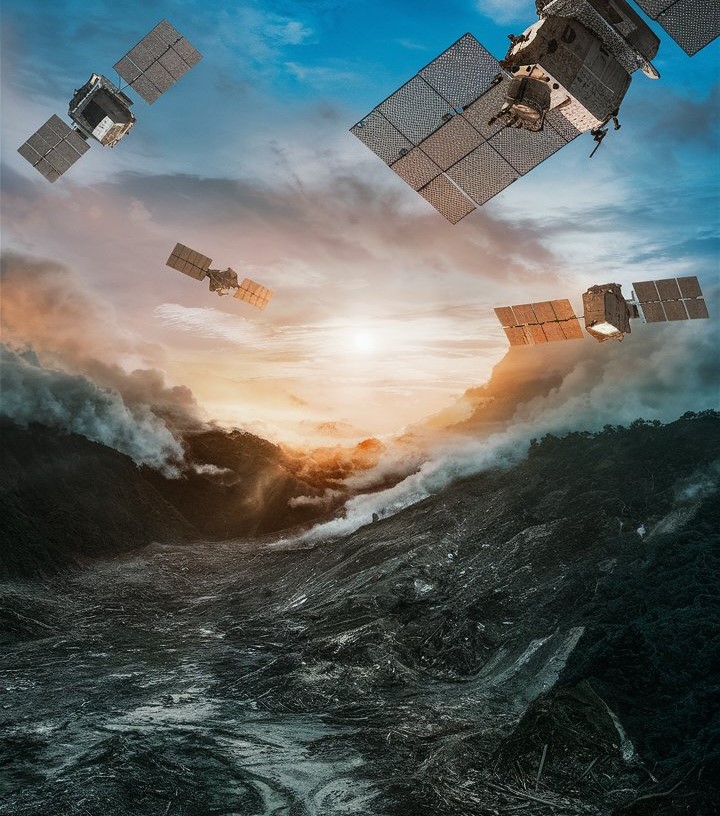 A mining site consists of numerous constructed embankments and slopes of all types and heights. Many of these slopes may be creeping and moving all the time – it’s a living beast.
 Part 2 of this blog post will focus on the remaining engineering work to finish Chapter 16 of the Technical Report. We only wrote about half of it in Part 1. The mining engineer can generally handle the rest of these tasks in this Chwithout requiring a lot of external input. You can read Part 1 at this link “
 Two dilution approaches are common. One can either construct a diluted block model; or one can apply dilution afterwards in the production schedule. I have used both approaches at different times.
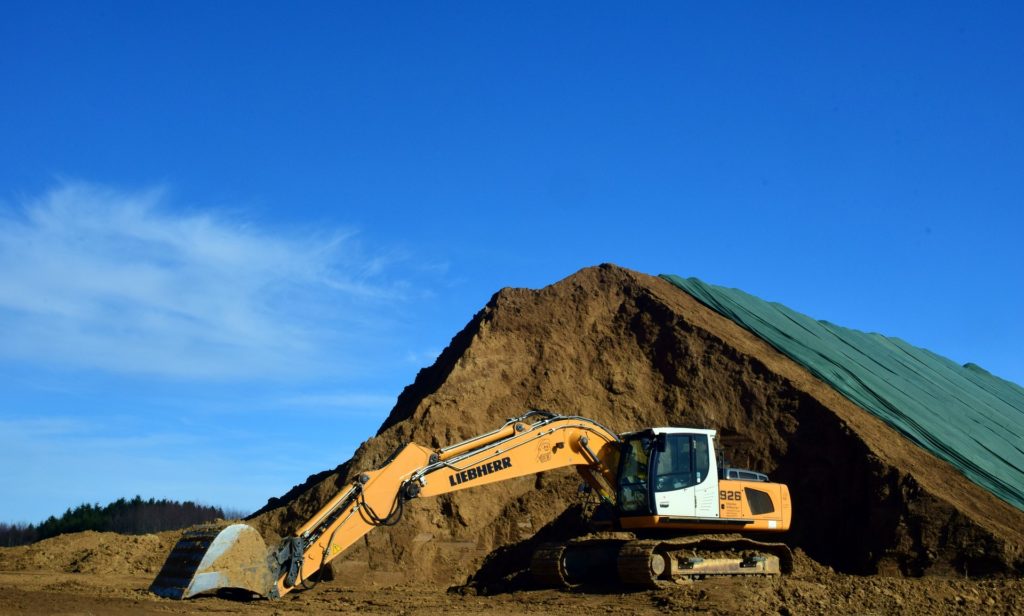 Sometimes lower grade stockpiles are built up by the mine each year but only processed at the end of the mine life. Periodically the ore mining rate may exceed the processing rate and other times it may be less. This is where the stockpile provides its value, smoothing the ore delivery to the plant.
 Once the production schedules are finalized, they are normally reviewed by the client for approval. The strip ratio and ore grade profile by date are of interest. One may then be asked to look to at different stockpiling approaches to see if an NPV (i.e. head grade) improvement is possible.
 The last task for the mine engineer in Chapter 16 is estimating the open pit equipment fleet and manpower needs. The capital and operating costs for the mining operation will also be calculated as part of this work, but the costs are only presented in Chapter 21.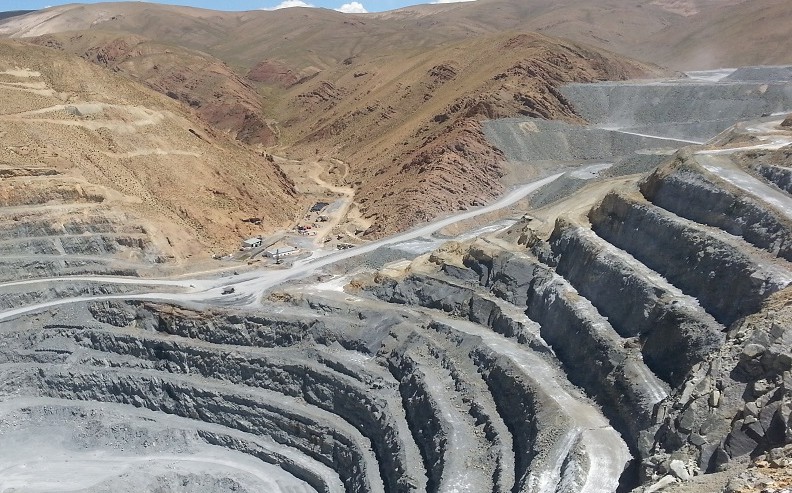
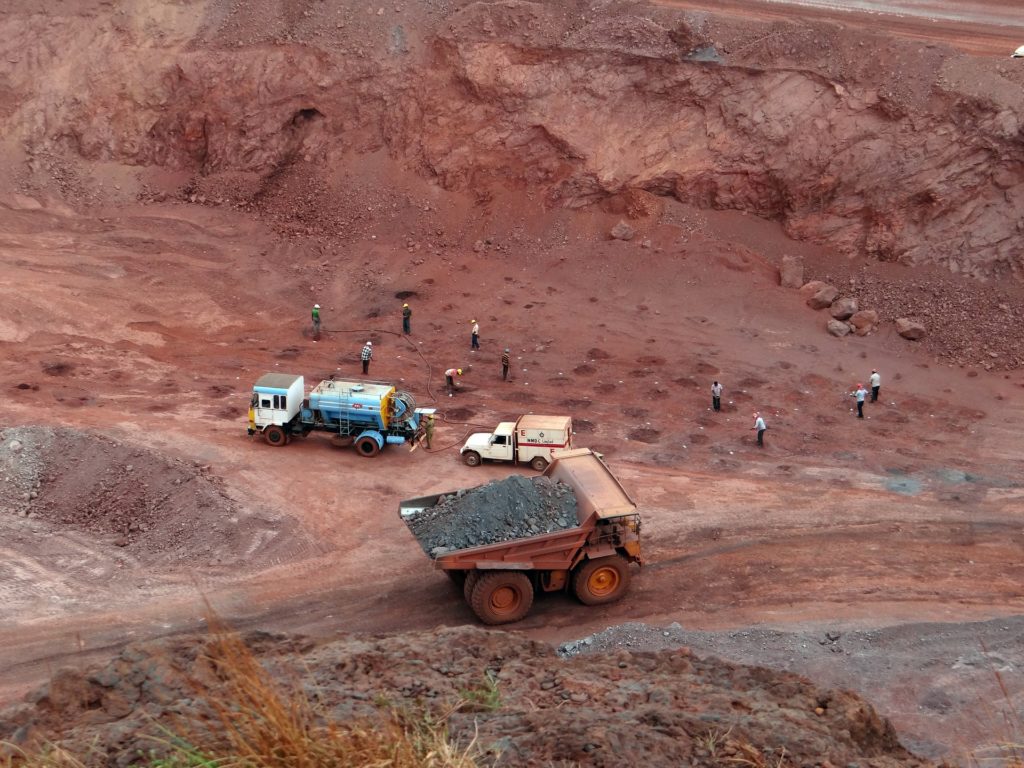 The support equipment needs (dozers, graders, pickups, mechanics trucks, etc.) are typically fixed. For example, 2 graders per year regardless if the annual tonnages mined fluctuate.
 These two blog posts give an overview of some of the things that mining engineers do as part of their jobs. Hopefully the posts also shed light on the amount of work that goes into Chapter 16 of a 43-101 report. While that chapter may not seem that long compared to some of the others, a lot of the effort is behind the scenes.
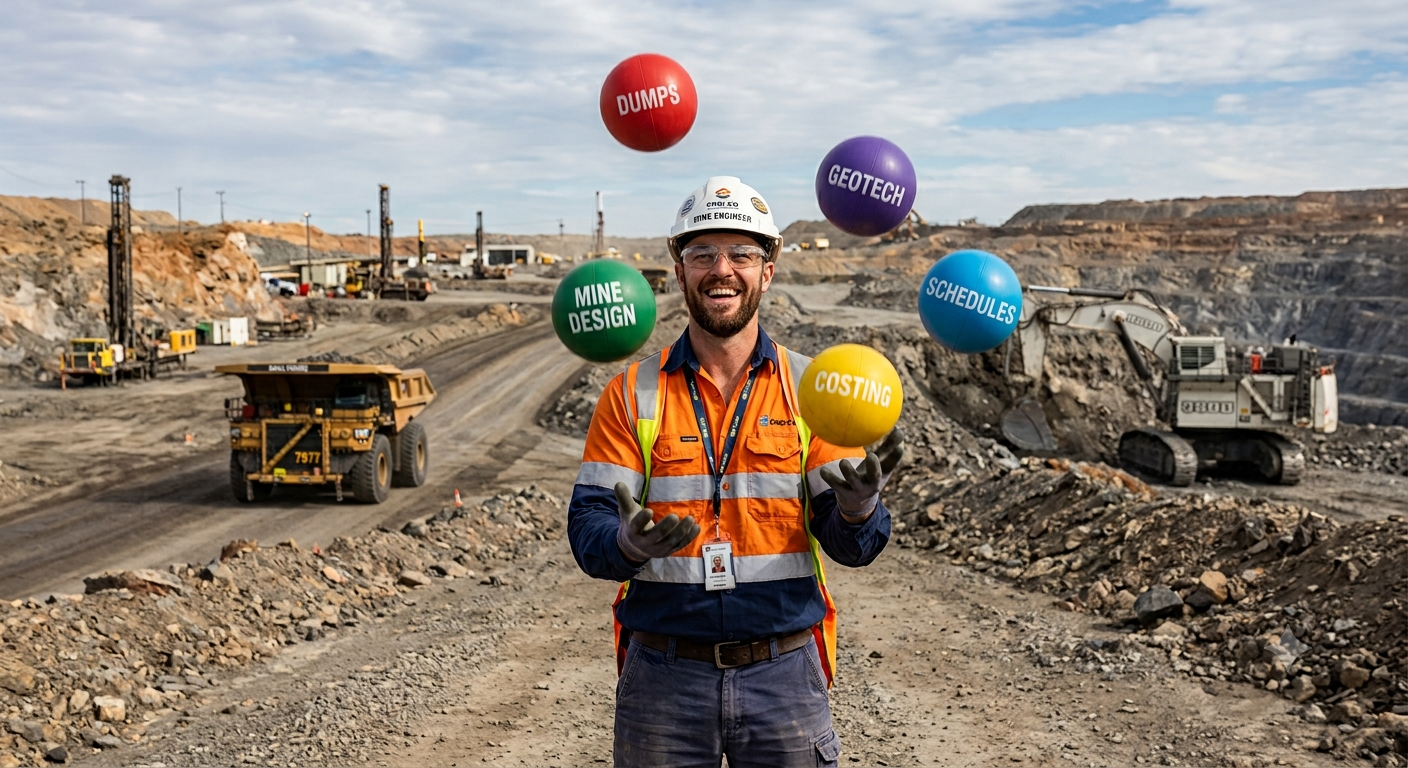 When people asl what I do and learn that I’m a mining engineer, I’ll normally get perplexed looks. Most people don’t even knew the job exists
 There is always a mineral resource estimate available before doing a PEA. The way the resource is being reported will indicate what type of mine this likely is. The geologists have already done some of the mining engineer’s work.
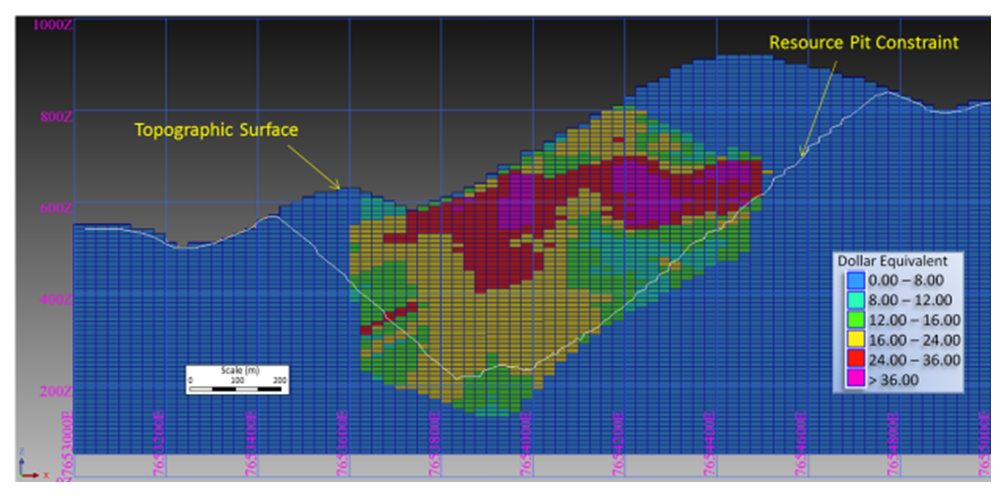
 Before starting pit optimization, we require economic inputs from several people. The base case metal prices must be selected (normally with input from the client). The mining operating cost per tonne must be estimated (by the mining engineer). The processing engineers will provide the processing cost and recovery for each ore type.
 Once the optimization is run, a series of nested pit shells are created, each with its own tonnes and grade. These shells are compared for incremental strip ratio, incremental head grade, total tonnes, and contained metal.
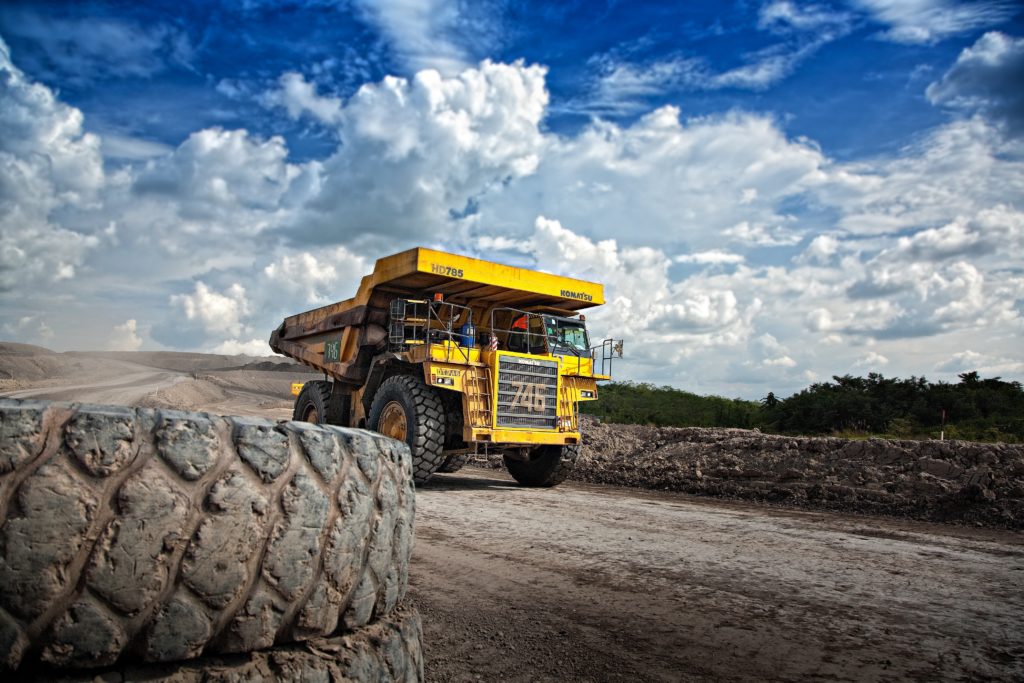
 The mining engineer is now ready to undertake the pit design. The pit design step introduces a benched slope profile, smooths out the pit shape, and adds haulroads. Hence a couple of key input parameters are required at this time. The mining engineer will need to know the geotechnical pit slope criteria and the truck size & haul road widths. Let’s look at both of these.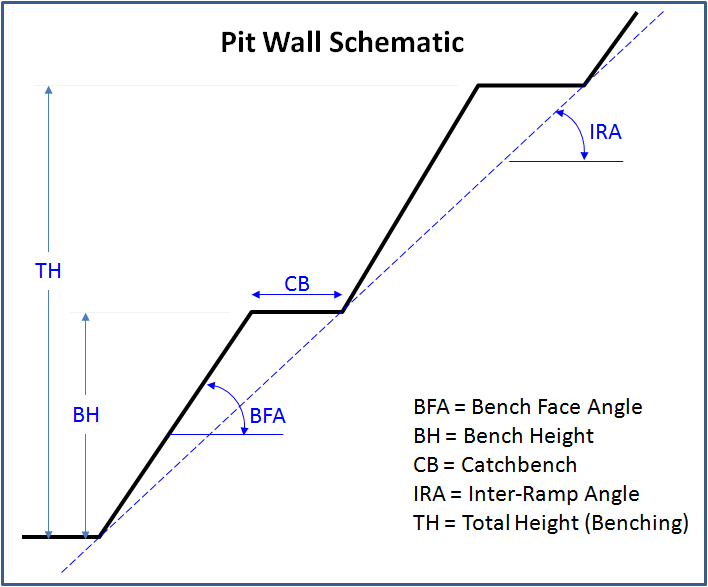
 Ramps: Next the mining engineer needs to select the truck size, even though the production schedule has not yet been created.
 This ends Part 1. In Part 2 we will discuss the mining engineer’s next tasks; production scheduling; waste dump design; and equipment selection. The mining engineer QP will sign off and take responsibility for all the mine design work done so far. You are probably wondering why you didn’t select mining engineering as a career. Part 2 is at this link “
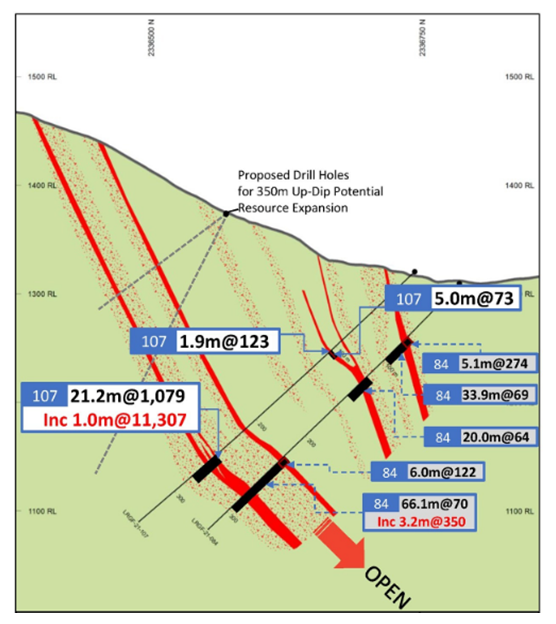 This article is about the benefit of preparing (cutting) more geological cross-sections and the value they bring.
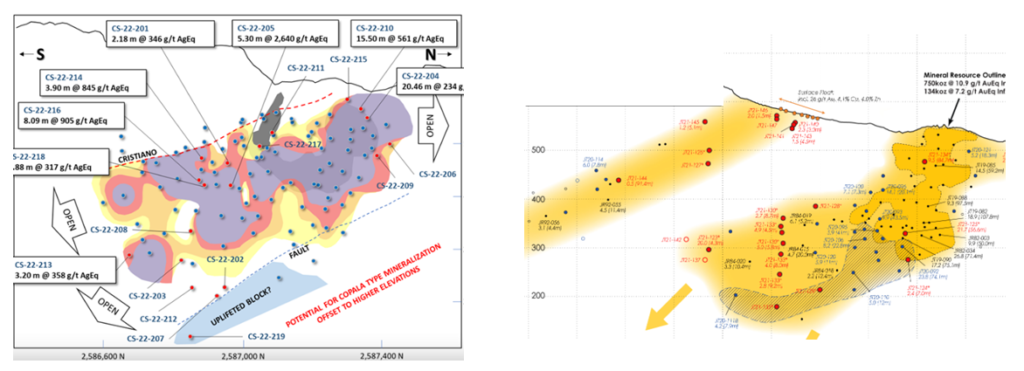 Long sections are aligned along the long axis of the deposit. They can be vertically oriented, although sometimes they may be tilted to follow the dip angle of an ore zone.
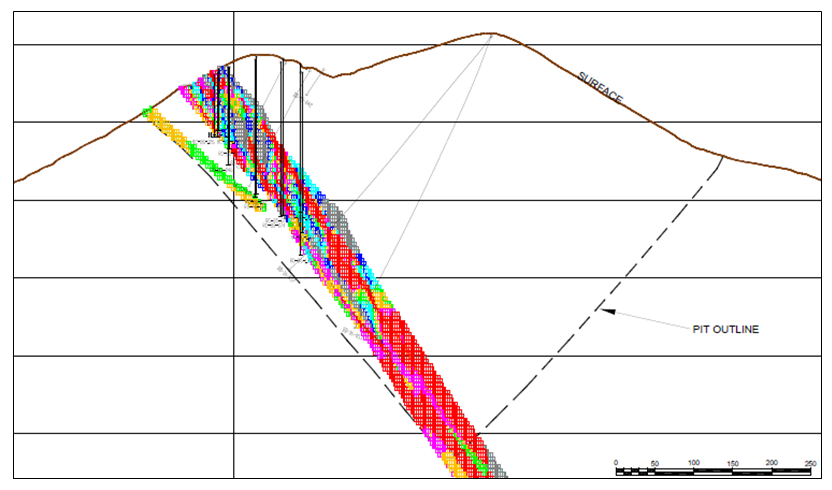 When looking at cross-sections, it is always important to look at multiple cross-sections across the orebody. Too often in reports one may be presented with the widest and juiciest ore zone, as if that was typical for the entire orebody. It likely is not typical.
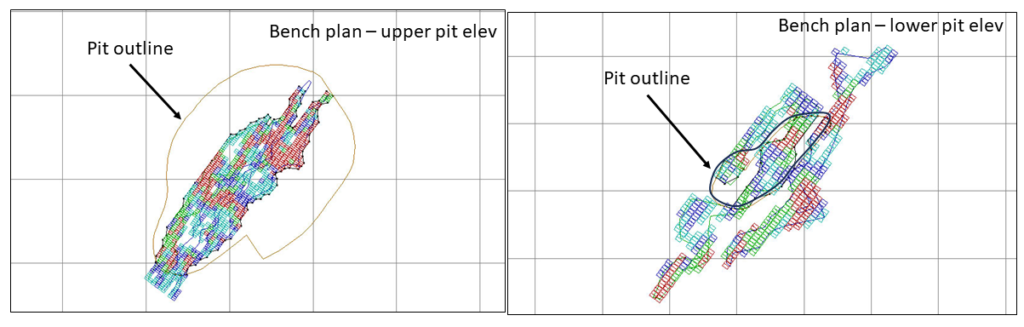 Bench plans (or level plans) are horizontal slices across the ore body at various elevations. In these sections one is looking down on the orebody from above.
 3D PDF files can be created by some of the geological software packages. They can export specific data of interest; for example topography, ore zone wireframes, underground workings, and block model information. These 3D files allows anyone to rotate an image, zoom in as needed and turn layers off and on.
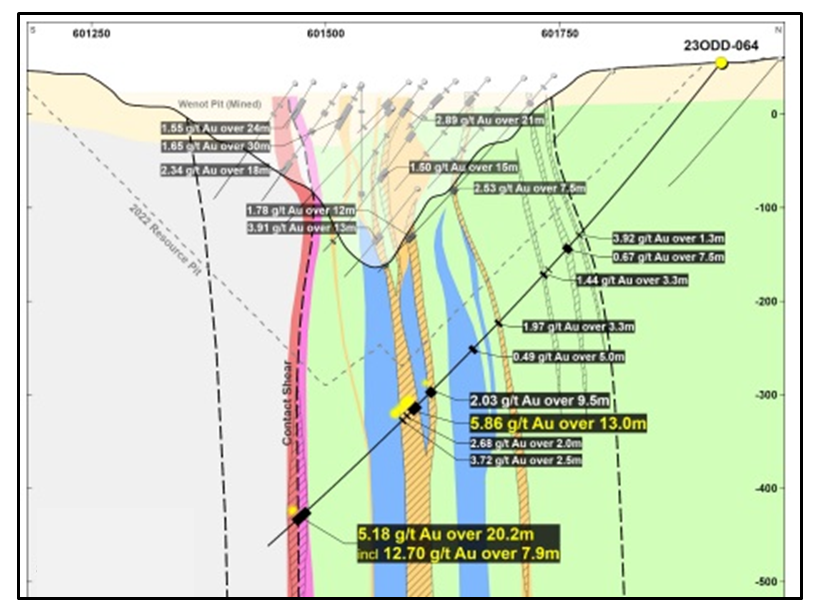 The different types of geological sections all provide useful information. Don’t focus only on cross-sections, and don’t focus only on one typical section. Create more sections at different orientations to help everyone understand better.