


 In this blog I wish to discuss some personal approaches used for interpreting pit optimization data. I’m not going to detail the basics of pit optimization, assuming the reader is already familiar with it .
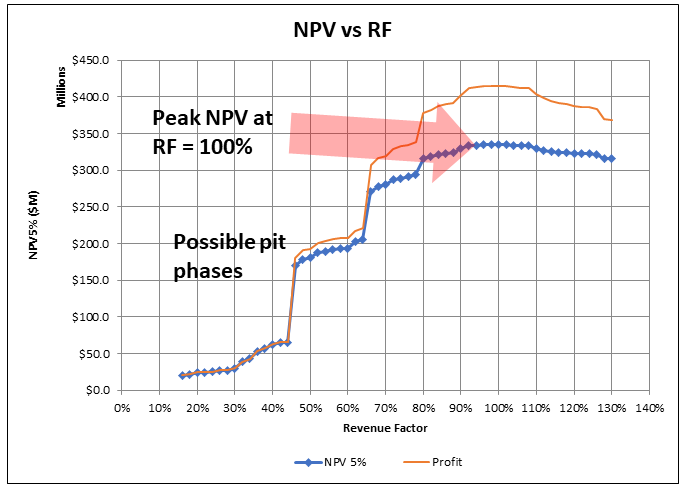 Often in 43-101 technical reports, when it comes to pit optimization, one is presented with the basic “NPV vs Revenue Factor (RF)” curve. That’s it.
Revenue Factor represents the percent of the base case metal price(s) used to optimize for the pit. For example, if the base case gold price is $1600/oz (100% RF), then the 80% RF is $1280/oz.
The pit shell used for pit design is often selected based on the NPV vs RF curve, with a brief explanation of why the specific shell was selected. Typically it’s the 100% RF shell or something near the top of the NPV curve.
However the pit optimization algorithm generates more data than just shown in the NPV graph. An example of that data is shown in the table below. For each Revenue Factor increment, the data for ore and waste tonnes is typically provided, along with strip ratio, NPV, Profit, Mining cost, Processing, and Total Cost at a minimum.
Luckily it is quick and easy to examine more of the data than just the NPV curve.

In many 43-101 reports, limited optimization analysis is presented. Perhaps the engineers did drill down deeper into the data and only included the NPV graph in the report for simplicity purposes. I have sometimes done this to avoid creating five pages of text on pit optimization alone, which few may have interest in. However, in due diligence data rooms I have also seen many optimization summary files with very limited interpretation of the optimization data.
 Pit optimization is a approximation process, as I outlined in a prior post titled “Pit Optimization–How I View It”. It is just a guide for pit design. One must not view it as a final and definitive answer to what is the best pit over the life of mine since optimization looks far into the future based on current information, .
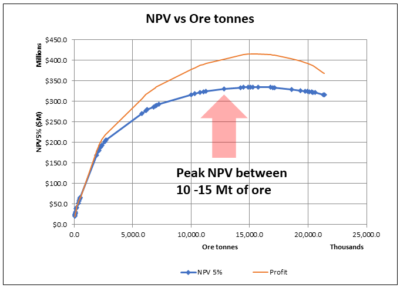
The pit optimization analysis does yield a fair bit of information about the ore body configuration, the vertical grade distribution, and addresses how all of that impacts on the pit size. Therefore I normally examine a few other plots that help shed light on the economics of the orebody. Each orebody is different and can behave differently in optimization. While pit averages are useful, it is crucial to examine the incremental economic impacts between the Revenue Factor shells.
What Else Can We Look At?
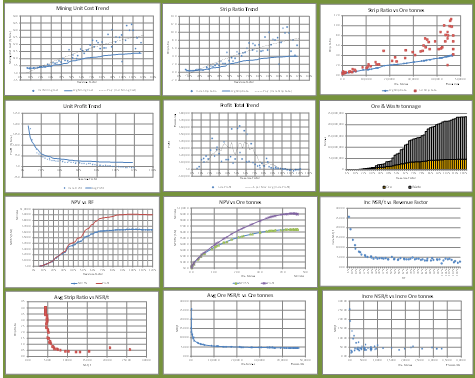
The following charts illustrate the types of information that can be examined with the optimization data. Some of these relate to ore and waste tonnage. Some relate to mining costs. Incremental strip ratios, especially in high grade deposits, can be such that open pit mining costs (per tonne of ore) approach or exceed the costs of underground mining. Other charts relate to incremental NPV or Profit per tonne per Revenue Factor. (Apologies if the chart layout below appears odd…responsive web pages can behave oddly on different devices).


Conclusion
 It’s always a good idea to drill down deeper into the optimization output data, even if you don’t intend to present that analysis in a final report. It will help develop an understanding of the nature of the orebody.

 The majority of mining projects tend to consist of either open pit only or underground only operations. However there are instances where the orebody is such that eventually the mine must transition from open pit to underground. Open pit stripping ratios can reach uneconomic levels hence the need for the change in direction.
 There are several reasons why open pit and underground can be considered as two different projects within the same project.
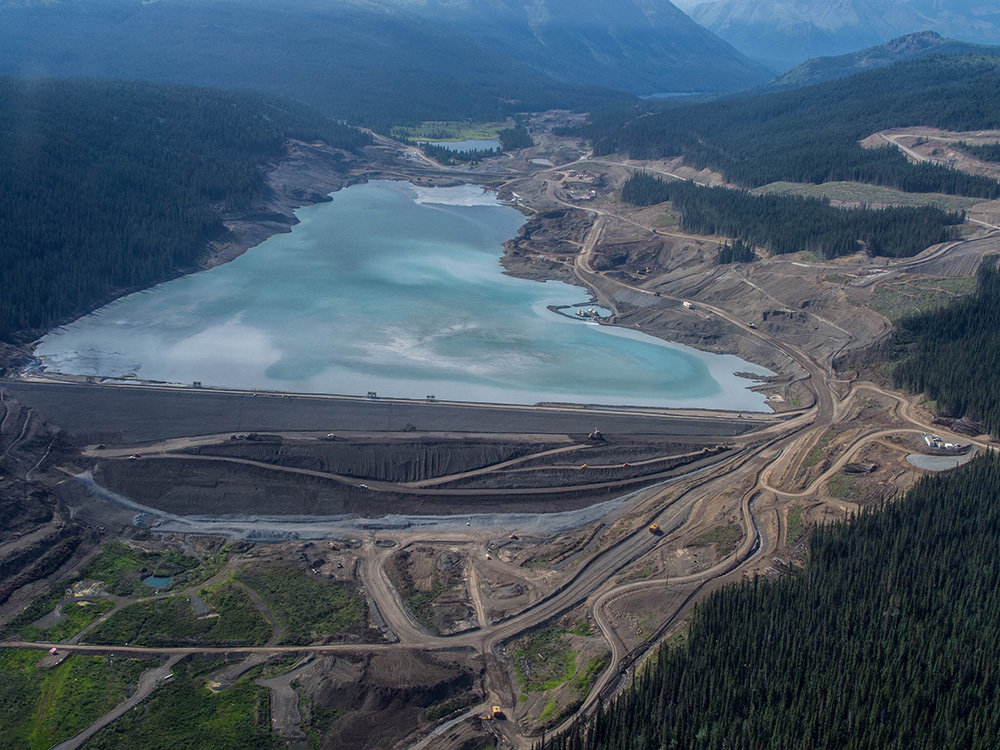 An underground mine that uses a backfilling method will be able to dispose of some tailings underground. Conversely moving towards a larger open pit will require a larger tailings pond, larger waste dumps and overall larger footprint. This helps make the case for underground mining, particularly where surface area is restricted or local communities are anti-open pit.
 Open pit and underground operations will require different skill sets from the perspective of supervision, technical, and operations. Underground mining can be a highly specialized skill while open pit mining is similar to earthworks construction where skilled labour is more readily available globally. Do local people want to learn underground mining skills? Do management teams have the capability and desire to manage both these mining approaches at the same time?
 As you can see from the foregoing discussion, there are a multitude of factors playing off one another when examining the open pit to underground cross-over point. It can be like trying to mesh two different projects together.
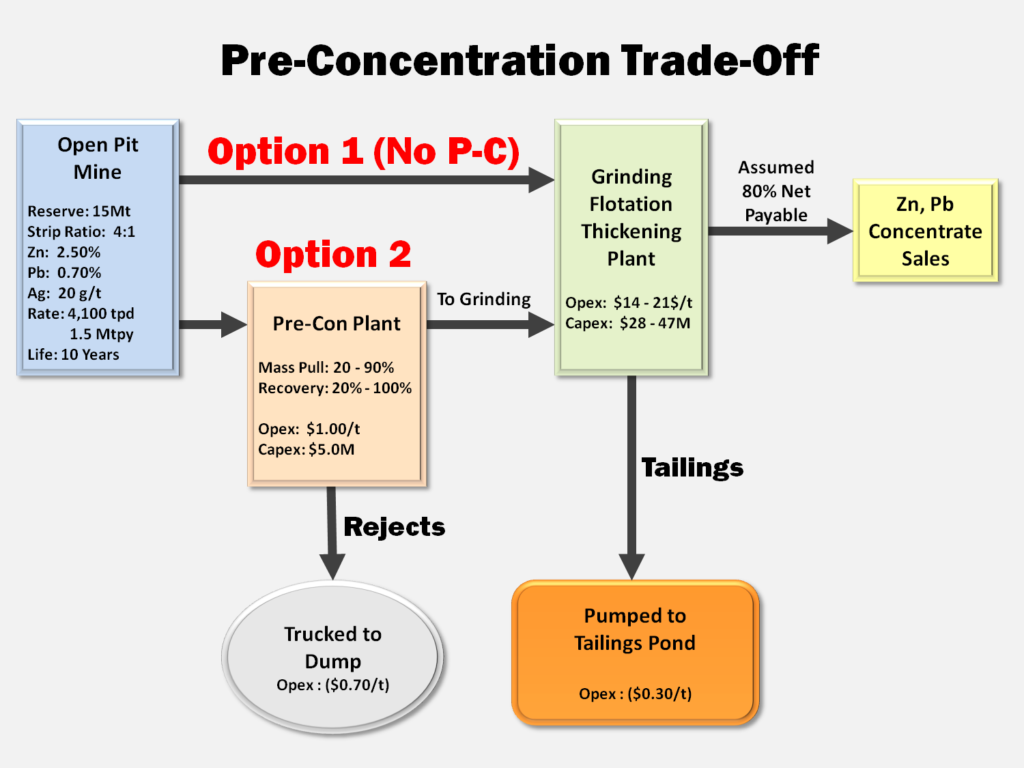
 Concentrate handling systems may not differ much between model options since roughly the same amount of final concentrate is (hopefully) generated.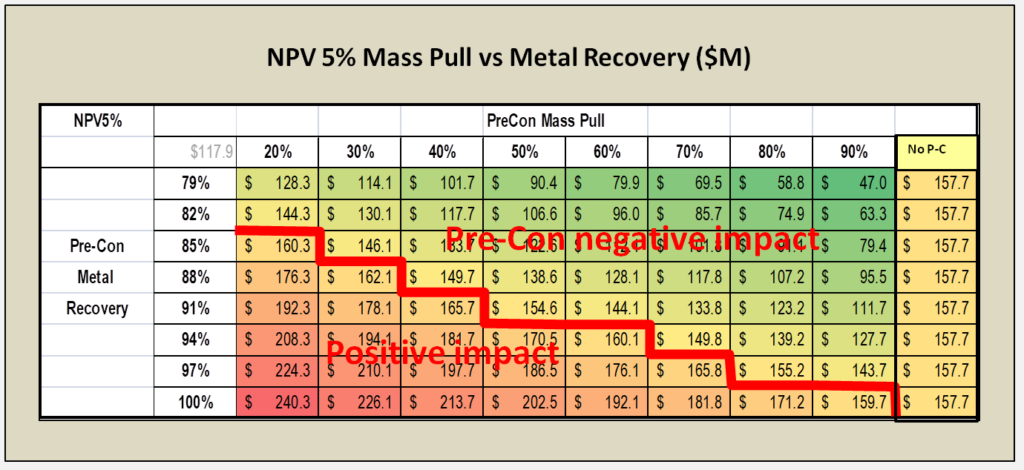
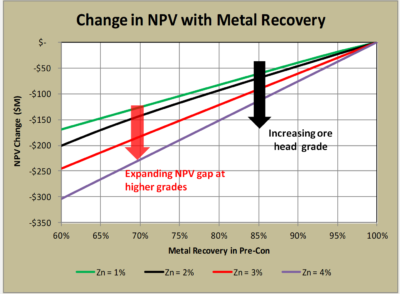 4. The head grade of the deposit also determines how economically risky pre-concentration might be. In higher grade ore bodies, the negative impact of any metal loss in pre-concentration may be offset by accepting higher cost for grinding (see chart on the right).
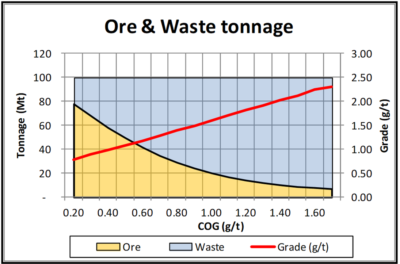 I had a grade tonnage curve, including the tonnes of ore and waste, for a designed pit. This data is shown graphically on the right. Essentially the mineable reserve is 62 Mt @ 0.94 g/t Pd with a strip ratio of 0.6 at a breakeven cutoff grade of 0.35 g/t. It’s a large tonnage, low strip ratio, and low grade deposit. The total pit tonnage is 100 Mt of combined ore and waste.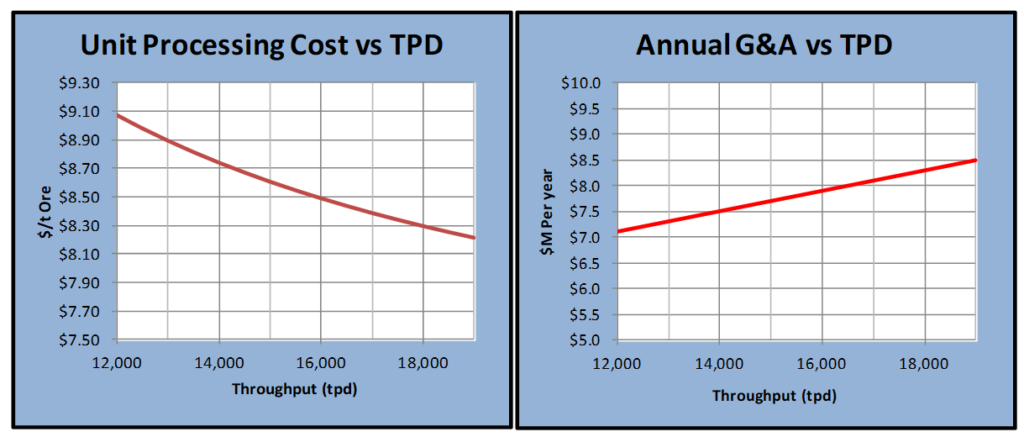

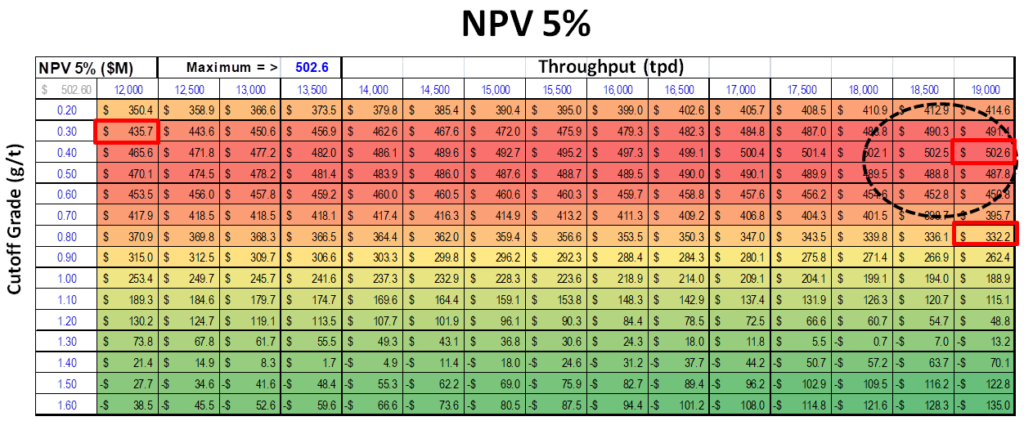

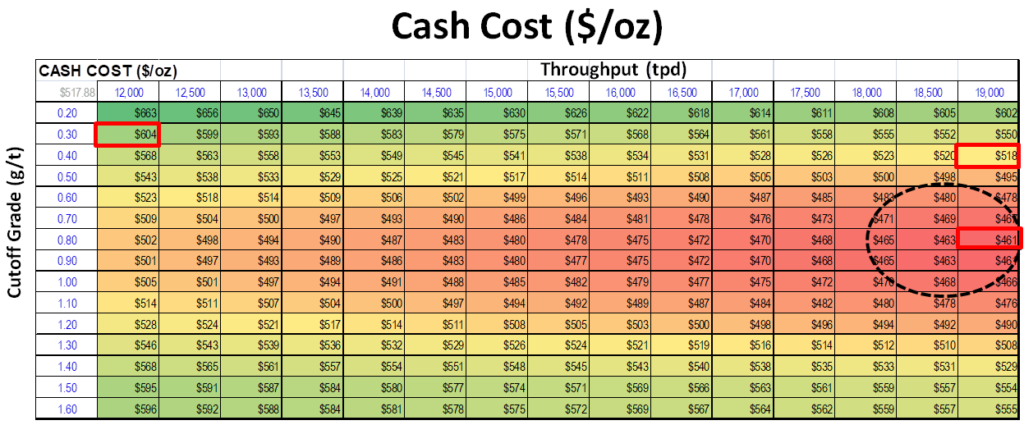
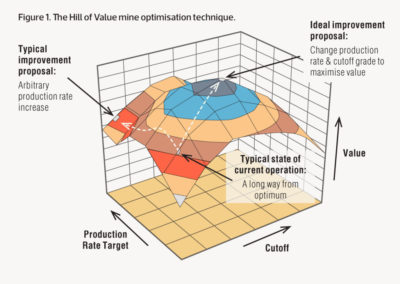
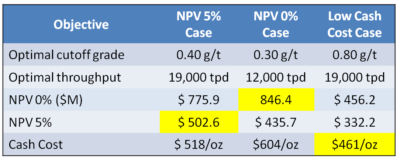 The Hill of Value is an interesting optimization concept to apply to a project. In the example I have provided, the optimal project varies depending on what the financial objective is. I don’t know if this would be the case with all projects, however I suspect so.

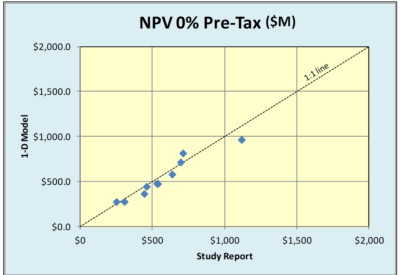 One of the questions I have been asked is how valid is the 1D approach compared to the standard 2D cashflow model. In order to examine that, I have randomly selected several recent 43-101 studies and plugged their reserve and cost parameters into the 1D model.
 There is surprisingly good agreement on both the discounted and undiscounted cases. Even the before and after tax cases look reasonably close.
 Previously I posted a blog about different approaches that mining engineers use to forecast dilution in an open pit setting. You can read the blog at
 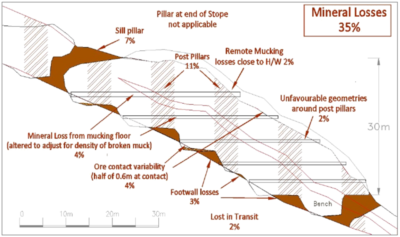 I am not going into detail on Paul’s paper, however some of my key takeaways are as follows. Download the paper to read the rationale behind these ideas.
 The bottom line is that not everyone will necessarily agree with all the conclusions of Paul’s paper on underground dilution. However it does raise many issues for technical consideration on your project.
 From 1997 to 2000 I was involved in the feasibility study and initial engineering for the Diavik open pit mine in the Northwest Territories. As you can see from the photo on the right, groundwater inflows were going to be a potential mining issue.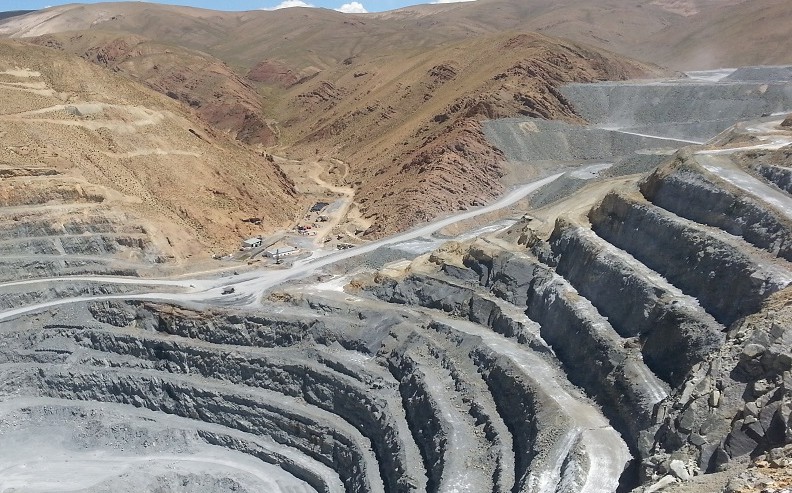
 Groundwater modelling of a fractured rock mass is different than modelling a homogeneous aquifer, like sand or gravel. Discrete structures in the rock mass will be the controlling factor on seepage rates yet such structures can be difficult to detect beforehand.
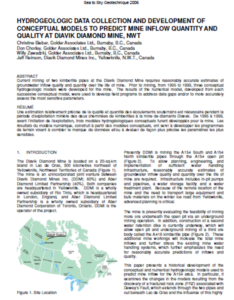 The 2000 paper describes the field investigations, the 1999 modeling assumptions, and results. You can download that
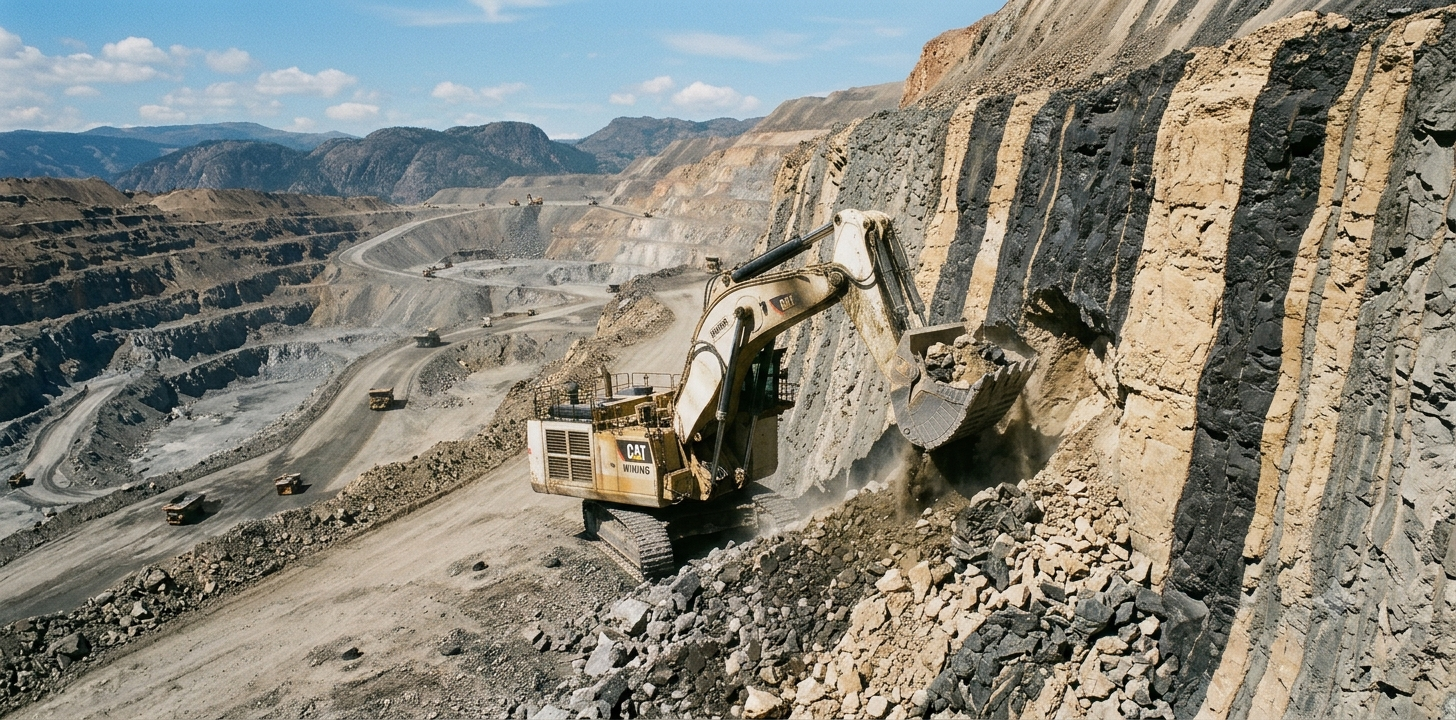 Over the years of working on studies and reviewing them, ore dilution often does not see much discussion but it is one of the most important technical and operational issues. It plays a key role in the success of a mining operation, particularly underground operations. In studies, it can be too low or too high, too optimistic or too pessimistic.

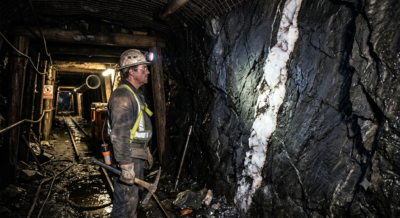 The goal of dilution estimation is not to demonstrate fancy mathematics, but to forecast what it will actually be. My personal experience is that people tend to focus on the value of the dilution percentage and whether it seems reasonable in the end. There seems to be less focus on the logic for the dilution approach used. It is not easy to forecast dilution yet it can be an incredibly important number.

 (Orig-2016 Updated-2026)
 Like the tailings design, would it be a good idea for companies to have a second set of eyes take a look at the resource estimates developed by their independent QP’s? Probably yes, with a few caveats. First I would like to clarify that an independent review can consist of three levels of review.