
 Normally I don’t write about mining stock markets, preferring instead to focus on technical matters. However I have seen some recent discussions on Twitter about stock price trends. For every stock there are a wide range of price expectations. Ultimately some of the expectations and realizations can be linked back to the Lassonde Curve.
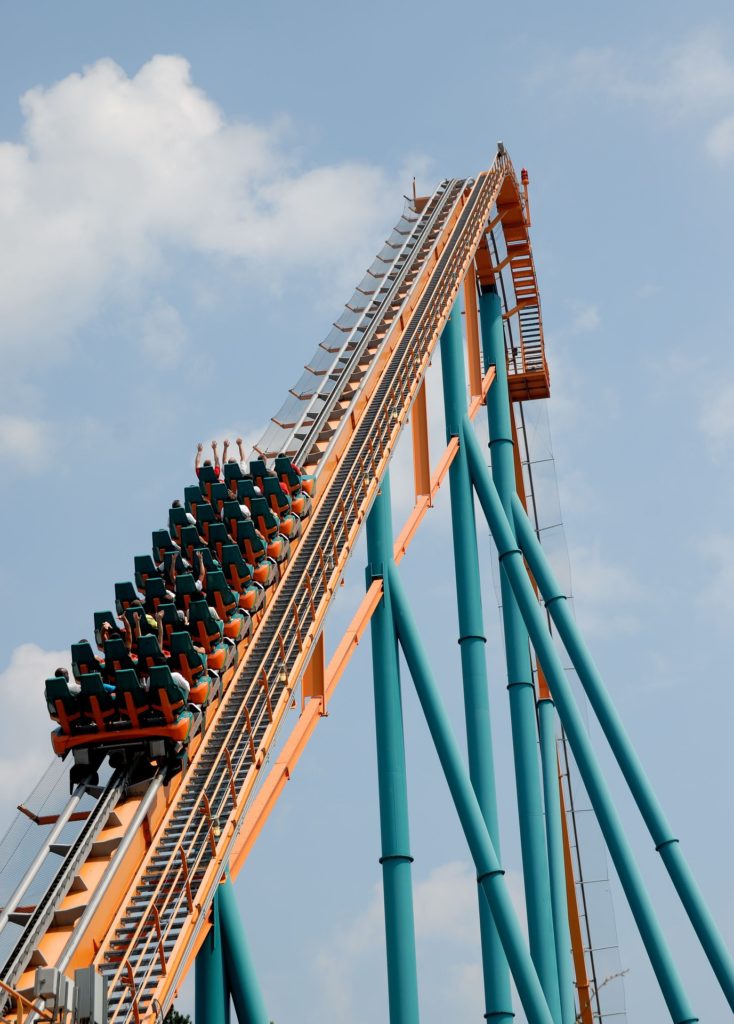
The Lassonde Curve has been touted by many as a realistic representation of the life stages of a junior mining company. The curve can sometimes be a roller coaster ride for company management.
Pierre Lassonde, was one of the founders of Franco-Nevada, the first gold royalty company. Thirty years ago he created his curve, that has now become a foundation in the junior mining business. The Lassonde Curve outlines the company life stages, beginning at exploration and ending at production. It shows the perceived value (i.e. stock value) that investors may assign at each life stage.
The stock price trend illustrated by the curve can, knowingly or unknowingly, impact on a company’s decision making process. So in effect, there are some technical ramifications from it.
People may have differing opinions on what factors are driving the curve. Take a look at it and decide for yourself. Typically people define the curve into four life stages, but I tend to view it in five stages.

Mining Company Stages 1 to 5
Stage 1 Climb
Stage 1 is the earliest stage, consisting of exploration. This period generates rising anticipation from promotion and exciting press releases. The stock value climbs as the perceived value of the insitu geology increases. Great Bear is an example of company currently in Stage 1 (as of June 2020), and appears to be in no hurry to exit from Stage 1.
Stage 2 is when the prospect moves into technical evaluation. In other words, the engineers now climb aboard the ride. This stage encompasses the PEA, PFS, and FS studies. Each of these can take months to complete, meantime new information releases may be lacking.
If the stock value declines, perhaps its because the engineers bring reality into the picture. Investors may see that the project isn’t as easy or great as they anticipated during Stage 1.
Companies can also lose some presence in the market with no new news. Investors may begin looking at other companies that are still in Stage 1 and hence sell their shares.
Some companies may try to shorten Stage 2 and even skip over Stage 3 by going from a PEA directly into Stage 4 construction.
Stage 3 is the period when the studies have largely been completed and a production decision is pending. At this time the company will be seeking strategic partners and project funding. Permitting is also underway. Unfortunately a lack of financing or poor permitting efforts will extend the time in Stage 3, which can extend for decades or even perpetuity. It’s easy to rattle off the names of companies sitting in Stage 3; for example Donlin Creek, Casino, KSM, and Galore Creek. It seems that once locked in a prolonged Stage 3, it can be difficult to get out of it. Company promotion and marketing can be difficult.
Stage 4 begins when the financing is done and construction begins. This is a sign that the project has been figured out, permits approved, and third-party due diligence found no fatal flaws. The stock value may increase on this positive news, especially if construction is on time and on budget. Its even better news if it’s a period of rising commodity prices.
 Stage 5 is the start-up and commercial production period, possibly nerve-racking for some investors. This is where the rubber hits the road. The stock price can fall if milled grades, operating costs, or production rates are not as expected.
Investors may need to decipher press releases to figure out if things are going well or not. Some investors may now bail out at this time to companies in Stage 1 for greater upside (the 10 bagger).
Companies Staying front and center
Companies know that investors can move elsewhere at any time, so they will try to address the Stage 2 and Stage 3 doldrums in different ways. They can:
-
Find new exploration prospects elsewhere while the engineering work is underway.
-
Undertake a series of optimization studies on the same project to keep up the news flow.
-
Continue step out drilling on the same property to expand resources and generate new excitement.
-
Have management appear regularly on podcasts, webinars, conferences, and keep promoting on LinkedIn, Twitter, and with newsletter writers.
Ideally one would like to stagger multiple prospects at different stages of the Curve. While this makes sense, it also takes a fair bit of funding to do it. It also may bring criticism that the company is losing focus on their flagship project. Generally if the stock price is improving, you don’t see this complaint.
Conclusion
 Some corporate presentations will highlight the Lassonde Curve, particularly when they are rising in Stage 1. You are less likely to see the curve presented when they are rolling along in Stages 2 or 3.
Pingback: The Lassonde Curve – A Wild Ride by Ken Kuchling - Mining Stock Education
Pure Gold Mining is the only company in Canada that is in the middle of Stage 4 this whole year. Lovin’ it!
You might be right, I can’t think of too many others in construction in Canada right now.
Treasury Metals (TML) should enter phase 4 in a few months with its Goliath project.
However, the takeover of Goldlund risks further delaying the timing since this integration aims to achieve synergies and economies of scale while ensuring a critical size of reserves!
I thought Treasury was still at the PFS stage (Stage 2)?
Thanks for providing your expertise for others to learn
I’m in a number of names, however my highest risk explorer is ,ENDR.v Enduro Metals http://www.endurometals.com (has new management, formerly Crystal Lake Mining) run by Cole Evens of https://hegexplore.ca .
I find the Lassonde curve, interesting, mainly due to the many variations of what the Y axis is labeled as. In this case stock price, I have also seen just value and other variations. I haven’t seen the original Lassonde curve, my understanding is, it is as you have it. What is the impact of equity raisings diluting stock and lowering stock value? If they are a true junior they will need money to do the PEA, PFS, etc. Would be interesting to see market cap on a second Y axis, whether it is smoother than the stock price dips.
I think the y-axis, whether value or stock price are really the same. Note that these are “perceived” values by investors, going from enthusiastic to bored to enthusiastic again. As the project advances the real enterprise value doesn’t really decrease and then rise, however the investor’s perceived value in the market may follow the curve. Much of it may relate to news flow; drilling can result in exciting press releases causing investors to buy in; doing engineering studies results in less news flow or less exciting news. This makes some investors sell and move to more exciting companies.
Helium is classed as mining but to me it should be in oil and gas. Since we are talking continuous, as in new producing wells, would you say that the Lassonde Curve would still apply?
The Lassonde Curve really relates to how active a company is with news releases and fresh news. With any commodity, including helium, if the company goes about its business behind the scenes developing its project with no flashy news to report, investors may move elsewhere thinking the company isn’t doing a lot. That really is the Lassonde curve, low news flow during construction, might cause investors to leave thereby lowering the share price valley.
Thanks for introduce the ‘Lassonde Curve’. I have invested in KEFI. It is an Ethiopian and Saudi-Arabian mine run by Harry Cypriot. We all hope he will give us the rewards.