Global Tax Regimes – How Do They Compare?

mining economics
Update: This blog was originally written in Feb 2016, but has been updated in Aug 2019.
As a reminder for all QP’s doing economic analysis for PEA’s, don’t forget that one needs to present the economic results on an after-tax basis.
Every once in a while I still see PEA technical reports issued with only pre-tax financials.  That report is likely to get red- flagged by the securities regulators.  The company will need to amend their press release and technical report  to provide the after tax results.    No harm done other than some red faces.

Taxes can be complicated

When doing a tax calculation in your model, where can you find international tax information?  PWC has a very useful tax-related website.  The weblink below was sent to me by one of my industry colleagues and I thought it would be good to share it.
The PWC micro-site provides a host of tax and royalty information for selected countries.  The page is located at https://www.ey.com/gl/en/services/tax/global-tax-guide-archive
On the site they have a searchable database for tax information for specific countries.
The PWC tax and financial information includes topics such as:
  • Corporate tax rates
  • Excess profits taxes
  • Mineral taxes for different commodities
  • Mineral royalties
  • Rates of permissible amortization
  • VAT and other regulated payments
  • Export taxes
  • Withholding taxes
  • Fiscal stability agreements
  • Social contribution requirements
PWC has a great web site and hopefully they will keep the information up to date since tax changes happen constantly.  The website also has a guide related to the rules for the treatment of capital expenditures.   Check it out.  https://www.ey.com/gl/en/services/tax/global-tax-guide-archive
Note: If you would like to get notified when new blogs are posted, then sign up on the KJK mailing list on the website.  Otherwise I post notices on LinkedIn, so follow me at: https://www.linkedin.com/in/kenkuchling/.
Share

Resource Estimates – Are Independent Audits A Good Idea?

mining reserves
Question: How important is the integrity of a tailings dam to the successful operation of a mine?
Answer: Very important.
Tailings dam stability is so important that in some jurisdictions regulators may be requiring that mining companies have third party independent review boards or third party audits done on their tailings dams.  The feeling is that, although a reputable consultant may be doing the dam design, there is still a need for some outside oversight.
Differences in interpretation, experience, or errors of omission are a possibility regardless of who does the design.  Hence a second set of eyes can be beneficial.

Is the resource estimate important?

Next question is how important is the integrity of the resource and reserve estimate to the successful operation of a mine?
Answer: Very important.  The mine life, project economics, and shareholder value all rely on it.     So why aren’t a second set of eyes or third party audits very common?

NI 43-101 was the first step

In the years prior to 43-101, junior mining companies could produce their own resource estimates and disclose the results publicly.  With the advent of NI 43-101, a second set of eyes was introduced whereby an independent QP  could review the company’s internal resource and/or prepare their own estimate.  Now the QP ultimately takes legal responsible for the estimate.
Nowadays most small companies do not develop their own in-house resource estimates.  The task is generally awarded to an independent QP.

Resource estimation is a special skill

Possibly companies don’t prepare their own resource estimates due to the specialization needed in modelling and geostatistics. Maybe its due to the skills needed to operate block modeling software.   Maybe the companies feel that doing their own internal resource estimate is a waste of time since an independent QP will be doing the work anyway.

The QP is the final answer..or is it?

Currently it seems the project resource estimate is prepared solely by the QP or a team of QP’s.   In most cases this resource gets published without any other oversight. In other words no second set of eyes has taken a look at it.  We assume the QP is a qualified expert, their judgement is without question, and their work is error free.

Leapfrog Model

As we have seen, some resources estimates have been mishandled and disciplinary actions have been taken against QP’s.   The conclusion is that not all QP’s are perfect.
Just because someone meets the requirements to be a Competent Person or a Qualified Person does not automatically mean they are competent or qualified. Geological modeling is not an exact science and will be based on their personal experience.

What is good practice?

The question being asked is whether it would be good practice for companies to have a second set of eyes take a look at their resource estimates developed by independent QP’s?
Where I have been involved in due diligence for acquisitions or mergers, it is not uncommon for one side to rebuild the resource model with their own technical team.  They don’t have 100% confidence in the original resource handed over to them.   The first thing asked is for the drill hole database.
One downside to a third party review is the added cost to the owner.
Another downside is that when one consultant reviews another consultant’s work there is a tendency to have a list of concerns. Some of these may not be material, which then muddles the conclusion of the review.
On the positive side, a third party review may identify serious interpretation issues or judgement decisions that could be fatal to the resource.
If tailings dams are so important that they require a second set of eyes, why not the resource estimate?  After all, it is the foundation of it all.
Note: If you would like to get notified when new blogs are posted, then sign up on the KJK mailing list on the website.  Otherwise I post notices on LinkedIn, so follow me at: https://www.linkedin.com/in/kenkuchling/.
Share

Measured vs. Indicated Resources – Do We Treat Them the Same?

measured and indicated
One of the first things we normally look at when examining a resource estimate is how much of the resource is classified as Measured or Indicated (“M+I”) compared to the Inferred tonnage.  It is important to understand the uncertainty in the estimate and how much the Inferred proportion contributes.   Having said that, I think we tend to focus less on the split between the Measured and Indicated tonnages.

Inferred resources have a role

We are all aware of the regulatory limitations imposed by Inferred resources in mining studies.  They are speculative in nature and hence cannot be used in the economic models for pre-feasibility and feasibility studies. However Inferred resource can be used for production planing in a Preliminary Economic Assessment (“PEA”).
Inferred resources are so speculative that one cannot legally add them to the Measure and Indicated tonnages in a resource statement (although that is what everyone does).   I don’t really understand the concern with a mineral resource statement if it includes a row that adds M+I tonnage with Inferred tonnes, as long as everything is transparent.
When a PEA mining schedule is developed, the three resource classifications can be combined into a single tonnage value.  However in the resource statement the M+I+I cannot be totaled.  A bit contradictory.

Are Measured resources important?

It appears to me that companies are more interested in what resource tonnage meets the M+I threshold but are not as concerned about the tonnage split between Measured and Indicated.  It seems that M+I are largely being viewed the same.  Since both Measured and Indicated resources can be used in a feasibility economic analysis, does it matter if the tonnage is 100% Measured (Proven) or 100% Indicated (Probable)?
The NI 43-101 and CIM guidelines provide definitions for Measured and Indicated resources but do not specify any different treatment like they do for the Inferred resources.
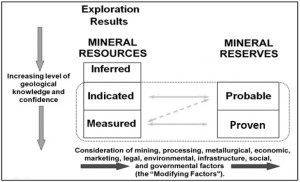
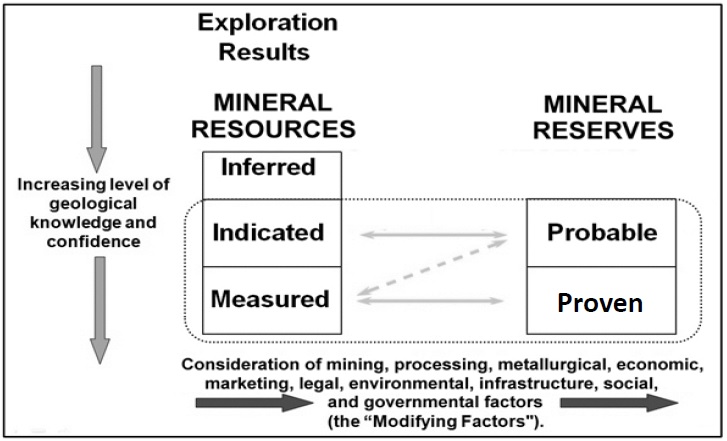
CIM Resources to Mineral Reserves

Relationship between Mineral Reserves and Mineral Resources (CIM Definition Standards).

Payback Period and Measured Resource

In my past experience with feasibility studies, some people applied a  rule-of-thumb that the majority of the tonnage mined during the payback period must consist of Measure resource (i.e. Proven reserve).
The goal was to reduce project risk by ensuring the production tonnage providing the capital recovery is based on the resource with the highest certainty.
Generally I do not see this requirement used often, although I am not aware of what everyone is doing in every study.   I realize there is a cost, and possibly a significant cost, to convert Indicated resource to Measured so there may be some hesitation in this approach. Hence it seems to be simpler for everyone to view the Measured and Indicated tonnages the same way.

Conclusion

NI 43-101 specifies how the Inferred resource can and cannot be utilized.  Is it a matter of time before the regulators start specifying how Measured and Indicated resources must be used?  There is some potential merit to this idea, however adding more regulation (and cost) to an already burdened industry would not be helpful.
Perhaps in the interest of transparency, feasibility studies should add two new rows to the bottom of the production schedule. These rows would show how the annual processing tonnages are split between Proven and Probable reserves. This enables one to can get a sense of the resource risk in the early years of the project.  Given the mining software available today, it isn’t hard to provide this additional detail.
Note: If you would like to get notified when new blogs are posted, then sign up on the KJK mailing list on the website.  Otherwise I post notices on LinkedIn, so follow me at: https://www.linkedin.com/in/kenkuchling/.
Share

Constraints: Use Them to Your Advantage

mining study management
I recently read a business book called “A Beautiful Constraint: How to Transform Your Limitations into Advantages, and Why It’s Everyone’s Business” by Adam Morgan and Mark Barden. It describes how to use constraints, like lack of time, or money, or resources and use them to help transform your company for the better.
Here’s an Amazon link to the book.  Beautiful Constraint Book Cover
The book discusses how to shift away from the typical “victim” role by understanding how our routines control things, ask the right questions, and focus on “how” and not “if”.

Focus on HOW and not IF

A good example: one of the recommendations in the book is in your team meetings no one on your team is allowed to utter the words “we can’t because…”.  They must replace those words with “we can if…”.   This forces the generation of ideas and promotes a positive attitude rather than a victim attitude.
The book describes how many innovative ideas are due to constraints and those innovations would never have come about without those constraints.
To force innovation in your organization you can create artificial constraints for your team.  This will foster innovative thinking and push for “outside the box” ideas.  The tougher the constraint, the greater the challenge for your team.  Possibly the greater the final outcome too.
The term Theory of Constraints may be common to some.  However that concept is different than what is being discussed in the book.  The TOC essentially relies on managing a constraint or eliminating it, and then addressing the next constraint in sequence.
The book authors instead propose to exploit the constraint or leverage it to create a new possibility.  Hence the title “beautiful constraint”.

Mining has no shortage of constraints

We all know the mining industry has more than enough constraints placed upon it today. It may be lack of funding, lack of skilled talent, environmental pressures, supply-demand issues, social issues, or security issues.  Each mining project may have additional constraints, so one probably doesn’t need to create artificial constraints for the team.
The mining industry has no option but to try to use these constraints in a constructive manner.  Miners must not let them pull the industry down nor simply wait until they go away.  When people say “Mining is cyclical and it will all turn around soon.”, that’s an example of waiting for the constraint to go away.

How long do you wait before taking your own action?

The bottom line is that the book is an eye opener and enlightening.  It may be telling some of us what we already know deep inside but don’t acknowledge openly.  Don’t wait any longer, start innovating, and don’t be afraid of grand innovations.
Note: If you would like to get notified when new blogs are posted, then sign up on the KJK mailing list on the website.  Otherwise I post notices on LinkedIn, so follow me at: https://www.linkedin.com/in/kenkuchling/.

Share

New Mining Software and 43-101 Legal Issues

43-101 issues
NI 43-101 puts a fair amount of legal liability on the Qualified Person preparing a resource or reserve estimate or sign off on an advanced study.  The QP is to be responsible for the accuracy of their work and take legal responsibility.
Every so often some new mining software comes along and I often wonder what are the risks in using it? Some examples of new mining software that I have heard about (but not personally used) nor have seen mentioned in any 43-101 studies are SimSched, the ThreeDify’s software packages, NPV One, and Bentley.

Is the software doing everything correctly?

Given that as a QP I am legally responsible for my work, I am  bit apprehensive about how I can be assured the new software will provide reliable and accurate results for which I accept legal liability.  The last thing I would want to do is issue a public technical report which is found to be in error due to a software bug.
Irrespective of 43-101, if you are working at a mining operation the last thing you want to do is present management with an incorrect reserve, pit design, or production plan.
If you are a consultant, how agreeable will your client be when you tell him that his study was done using a novel software package and not one of the industry standard packages, and there was an error in it?
I recall working with a major mining company and there was a reluctance to adopt any new software that was unproven and not an industry standard.  Money was not the issue; the company’s concern  was with the risk in using unproven software.

What if you have a limited budget?

How do you view new software if you have a limited budget?   The new software may be cheaper, may appear to be be great, and may be a technological improvement and all at a lower cost.  However the software risk still remains.  There is no guarantee that all software output is correct simply because it comes from a computer.
As a QP, I suggest the onus is on the software developers to demonstrate that they can produce reliable and comparable results under all conditions.  They need to be able to convince the future users that their software is accurate.
Perhaps over time the new software will gain wider adoption and be generally accepted.  We may see more 43-101 reports that use it and hence it will get more overall acceptance.
Another question when developing a market for new software is whether it is better to focus on more consultant adoption or more mining company adoption?
Will mining companies use the software if their consultants are using it, or will consultants use it if more companies adopt it?  It’s an interesting discussion that new software vendors must deal with in trying to grow their market share.


Note: If you would like to get notified when new blogs are posted, then sign up on the KJK mailing list on the website. The entire blog post library can be found at this LINK with topics ranging from geotechnical, financial modelling, and junior mining investing.
Share

Independent Consultants Are Growing

I have read quite a few articles indicating that the mining industry is seeing a shortage of experienced people, on both the technical and management side of the business.  Apparently the baby boomer generation is now nearing their retirement or early-retirement stage and there is a gap in the number of experienced people following behind.
Many of these retirees enter the “independent consultant” stage of their careers.
I also hear from recruiters that there is a shortage of engineers willing to take remote or international assignments.  This is particularly difficult when a senior level candidate has a growing family.

Can the independent engineers help out?

In a previous article (14. Miners – Why Have Your Own Independent Consultant?) I discussed why mining companies (or even consulting firms) should make use of the independent engineers as advisers or Board members.
I understand from colleagues in the mining industry that many of the people nearing retirement are willing to take on consulting assignments or board or directors roles or other management roles.  They are often willing to work part time and independently.  Or they may work as “associates” with engineering firms.
So there likely is a significant network of experienced people out there.  It’s just a matter of being able to tap into that network when someone needs specific expertise.
So how can one do this?
LinkedIn currently seems to be the only global network for technical people.  It is a great way to connect with engineers and geologists industry wide.
LinkedIn members work everywhere, at mine operations, consulting firms, financial houses,  as independents, or even retired. Almost every technical person I know is registered on LinkedIn.
The question is how to find these people when you are looking for a specific independent expertise for a short term or over the longer term.

Networking

Networking with people you already know is the most common approach.  However what if you need someone with particular knowledge?
LinkedIn is a great search mechanism for technical experts.  With a keyword search one can identify a lot of experts with very specific skill sets.  The problem is that many of the experts highlighted by the LinkedIn search may be fully employed at mining operations or with large consulting firms and may not be the person you are looking for.
To my knowledge, there is no searchable online registry solely intended for independent geologists and engineers.  It would be in the interests of the mining industry to have some type of easily searchable independent consultant directory to be able to tap into the expertise that is out there.  I understand that MineLife.org  is attempting to build such an online service but it still appears to be early in the development stage.
Share

Open Pit Optimization – How I View It

Mining feasibility study
One of the first steps in an open pit design is the pit optimization analysis.  Pit optimization is used to define the most profitable pit shell for a given set of economic parameters.  The economic parameters include the metal prices, processing recoveries, and site operating costs. Normally when optimization is done, a range of metal prices or Revenue Factors (“RF”) is used to develop a series of nested shells to understand how the pit will expand or contract with increasing or decreasing metal prices.
Once the optimization step is complete, mining engineers will then design the pit inside that shell, introducing benches and ramps.  The pit design should mimic the selected optimized shell as closely as possible.
The pit design may (or may not) closely replicate the optimization shell depending on the slope angles used in the optimization and where the haul ramps are located in the design.
Hence the actual ore and waste tonnages mined may be different that the tonnages defined by the optimizer.
Various experts in pit optimization will use approaches of differing complexity.  Some may apply variable mining costs with pit depth; apply variable process recoveries linked to head grade; apply variable pit slopes by sector or depth, apply dilution and ore losses; etc.   One can make the pit optimization step as simple or detailed as one wants it.
The question is whether detailed pit optimization is warranted.  My view is that overly detailed pit optimization is  not required, other than if one wants to test parameter sensitivity on the resulting pit size and shape.  There are just too many uncertainties in the parameters being used in optimization.

Open Pit Optimization Uncertainties

Some of the uncertainties involved in the optimization approach are listed below:
  • Pit optimization can generate large pits that would have a long mine life.  However one doesn’t really know the metal prices far into the future.   So will that final pit ever get mined, or might it even be larger than shown.
  • Pit optimization is typically done at the start of a study, so one doesn’t have the detailed operating costs yet. The size of the project may be unknown and one has to use rough estimates for future costs and possibly even assume preliminary process recoveries.
  • Operating costs will also change in the future, and the optimization step is just a snapshot using current information.
  • Sometimes the optimization includes the use of Inferred resources, which are uncertainty.   Sometimes optimization is done only using Measured and Indicated resource, yet there may be areas if Inferred resource that ultimately convert to M &I and these will have been ignored.  So, either way you do it, you are not sure what ore the pit can captured and will  to shape the pit.
  • The smaller pits, if developed, would consist of smaller operations and may have different operating costs than assumed in the optimization.   Similarly larger pits may have different throughput rates and  operating costs than assumed in the optimization.
  • The ore and waste split reported within the pit will be based on a specific life-of-mine cutoff grade.  This is based on the fixed metal price and operating cost assumptions applied.
  • Overall pit wall slopes may differ for shallow pits versus deep pits.  Slopes may vary above the groundwater table and below it.  In many instances during pit optimization the wall angles are maintained at the same angle irrespective of the pit depths.   Sometimes geotechnical programs have not yet been completed, so optimization slope angles are simply educated guesses.
  • Dilution may be applied globally during pit optimization (unless one is working with a diluted block model).  In reality, dilution may differ in different parts of the ore body, and that may not be considered in the optimization stage. For more discussion on dilution in general, read the blog “Ore Dilution Prediction – Its Always an Issue“.

Conclusion

The bottom line is that pit optimization should be viewed as a guide to the pit design, but not as a highly precise calculation.  There are too many uncertainties in the parameters used.
There is always opportunity for future miner operators to examine pushback to grow the pit larger than initially envisioned.  Having said all that, one should still understand how future changes in metal prices can impact on the pit size, and then assess whether practical pushbacks are possible.   Thin sliver pushbacks are operationally difficult so this should be understood at the start.
While open pit optimization is not a precise science, there is still merit in examining how the pit size and shape reacts to changes in different parameters.  There are many ways to examine this and help select which shell should be advanced into the design stage. It can be more than just looking at the NPV versus Revenue Factor chart.   You can read this post at this link “Pit Optimization – More Than Just a “NPV vs RF” .
Note: If you would like to get notified when new blogs are posted, then sign up on the KJK mailing list on the website.   Follow us on Twitter at @KJKLtd for updates and insights.
Share

Mining Project Economics – Simple 1D Model

mining desktop study
In a previous article I outlined my thoughts on the usefulness of early stage financial modelling (“Early Stage “What-if” Mine Economic Analysis – Its Valuable”).     My observation was that it is useful to take a few days to build a simple cashflow model to help your team better understand your project.

By “simple” I mean really simple.

This blog describes one of the techniques that I use to take a super-quick look at any project; whether it is for a client wishing to understand his project at a high level; or whether it is a project that I have read about.  There isn’t any actual study or production schedule available yet.  Maybe there is only a mineral resource estimate available.
It takes about 10 minutes to plug the numbers into my template to get fast results.  The image below is an example of the simple model that I use, but anyone can build one for themselves.

Screenshot of Simple Economic Model

I use the term one dimensional (“1D”) model since it doesn’t use the typical X-Y matrix with years across the top and production data down the page.
The 1D model simply relies simple on life of mine (“LOM”) totals to estimate the total revenue, total operating cost, and total profit.  This determines how much capital expenditure the project can tolerate.
The only caveat is that you need to have some sense for operating and capital costs for similar projects. This analysis can be on both a pre-tax and simple after-tax basis.
Using estimated metal prices and recoveries, the first step is to calculate the incremental revenue generated by each tonne of ore (see a previous article “Ore Value Calculator – What’s My Ore Worth?”).
Next that revenue per tonne is multiplied by the total ore tonnage to arrive at the total revenue over the life of mine.
The second step is to determine the life of mine operating cost, and again this simple calculation is based on estimated unit operating costs multiplied by the total tonnages being handled.
The third step is to calculate the life of mine profit based on total revenue minus total operating cost.
The potential net cashflow would be calculated by deducting an assumed capital cost from the life-of-mine profit.  The average annual cashflow is estimated based on the net cashflow divided by the mine life.  An approximate NPV can be calculated by determining the Present Value of a series of annual payments at a certain discount rate.
The reasonableness of the 1D model will be examined via benchmarking and this will be summarized once completed.  I will include a link to that future blog here.

You need to understand your project

One can easily evaluate the potential impact of changing metal prices, changing recoveries, ore tonnages, operating costs, etc. to see what the economic or operational drivers are for this project.  This can help you understand what you might need in order to make the project viable.

Conclusion

The bottom line is that a 1D economic calculation is very simplistic but still provides a vision for the project.  The next step in the economic modelling process would be a 2D model based on an annual production schedule.  The 1D approach is just a quick first step in looking at the potential.  You can do it even when you only know the head grades and some generalized orebody information.
The two ways you can apply the simple 1-D model are:
  1. evaluate the potential of early stage projects using cost inputs from other studies,
  2. examine a project’s sensitives (units costs, recoveries, prices) by calibrating your simple model to the published study (i.e. use the same parameters and make changes as needed.
The entire blog post library can be found at this LINK with topics ranging from geotechnical, financial modelling, and junior mining investing.


Note: If you would like to get notified when new blogs are posted, then sign up on the KJK mailing list on the website.  
Share

Work Breakdown Structures – Don’t Forget About The WBS

mining project WBS
Normally at the start of a mining study, the team members receive a matrix of responsibilities.  This table shows which people (or groups) are responsible for different aspects of the study, i.e. who is responsible for geology, for mine design, for process design, infrastructure, etc.  This is great tool and a necessity in making sure that everyone knows what they are supposed to do.
Next we generate a project schedule based on some work plan.  In realty this isn’t the correct sequence.

Sometimes the WBS is forgotten

What often gets forgotten in early stage studies is providing the team members a Work Breakdown Structure (“WBS”).   I consider the WBS an equally important component as the responsibility matrix and both should always be provided.
The WBS is a hierarchical breakdown of the project into phases, deliverables, and work packages usually associated with cost estimation. It is a tree based structure, developed by starting with the final objective and then dividing that into manageable components based on size, duration, and responsibility.  Typically this is done for the capital cost estimate, breaking it down into individual cost areas and cost components.  A WBS can also be used for the operating cost estimate.
request for propoalsThe WBS can provide the following information to the team:
  • It assigns the costing responsibility to specific people or group so each know what must be delivered.
  • It provides a consistent format for developing and reporting the capital costs (and operating costs).
  • It helps ensure that no cost components get omitted and no costs get double counted.
  • It provides the cashflow modeler with a clean format to import the capital cost into the cashflow model.
  • The WBS should be developed before the project schedule, not after it.

Any study will benefit from a WBS

Typically a WBS is developed for pre-feasibility and feasibility mining studies but is often ignored at the PEA stage.  Some feel it is too detailed for that level of study.  I don’t feel this is the case.
The WBS is a communication tool to confirm responsibilities.  Thus even a simplified WBS is still useful at the PEA stage.
I have seen some instances where a WBS has been created but does not get wide distribution to the entire team.  The WBS should be provided to everyone and ideally a team session be held to walk through the WBS structure.
The idea is not make everyone a costing expert, but rather to ensure all understand how the project cost estimate will be structured.

Conclusion

The bottom line is that regardless of the level of study, a WBS should always be created.
Some will say the WBS is not required for early stage studies but I have found benefits in having one, at least for the capital cost estimate.   Obviously the level of detail in the WBS should be appropriate to the level of the study.
Once the WBS is in place, then go ahead and build your project schedule.
A competent Study Manager can easily create an initial WBS, thereby mitigating some headaches when the final study is being assembled.   You may even want a basis WBs at the proposal stage.
By the way, before awarding a study to anyone, try to have a prepared Request for Proposal beforehand.   I have written about the benefit of this document in a blog post titled “Request For Proposal (“RFP”) – Always Prepare One
My entire blog post library can be found at this LINK with topics ranging from geotechnical, financial modelling, and junior mining investing.


Note: If you would like to get notified when new blogs are posted, then sign up on the KJK mailing list on the website.  
Share

Potash Ore Grades – Check the Units

KCl vs K2O
Having worked with the potash industry for many years, I have reviewed numerous geological reports for projects in Canada, Asia, Russia, and Africa.  One of the curious things that I have seen is the reporting of resource  grades in two different units; either as potassium oxide (K2O) or potassium chloride (KCl).

Is it K2O or KCl ?

Standard practice in the Saskatchewan industry is reporting ore grades using K2O units, with typical head grades in the range of 25% K2O.  Many of the international projects, but not all, have decided to use the KCl units. Therefore when comparing potash resource grades between deposits, one must be vigilant for the units used since there is a significant difference.
The conversion from K2O to KCl is based on the formula K2O = 0.6317 x KCl.   So a grade of 25% K20 is equal to 25/0.6317 = 39.6% KCl.  The KCl grade value is significantly higher.  The unit issue is relevant with low grade deposits, were an actual grade of 15% K2O may be reported as 23.7% KCl.  One might see the ore grade in KCl and assume it is comparable to Saskatchewan potash grades, when in reality they are quite different.

Concentration Ratio is the Key

When looking at different potash projects, particularly those involving underground mining, a key economic factor is the concentration ratio.  This ratio represents the tonnes of potash ore needed to produce a tonne of final saleable product.
Typically the final potash product has a grade of 60% K2O.  Therefore a potash ore with a grade of 25% K2O would have a concentration ratio of about 2.4:1 (60%/25%).  This means that 2.4 tonnes of potash must be processed to produce 1 tonne of product (ignoring the process recovery factor).   For a lower grade ore with a head grade of say 15% K2O, the concentration ratio is 4:1 (60%/15%).

potash mining

This gives a rough sense for the comparable operation size required to meet the same final product production levels.  This also gives a indication for the relative amounts of salt tailings requiring disposal.  Low grade ore can generate significant quantities of tailings, the disposal of which is becoming a larger permitting issue.
In the past gold grades have been reported as “oz/ton” or currently as “g/t”, but most geological reports today are consistent with “g/t”.  Sometimes US based gold projects may use “oz/ton” however the magnitude in reported grades are fairly obvious between grams and ounces.  That isn’t the case with potash grades.
The bottom line is that potash is one commodity that will use different units when reporting ore grades.  Investors and reviewers must be aware of which units are being used.
If you are into potash mining, I have written a couple of blog posts about my brief, but interesting, time working at a potash mine in Saskatchewan.   This was early in my career and I had roles that included mine engineer, chief mine engineer and production foreman.  Each of these roles gave me a different perspective about a mining operation. In this two part blog, I share some stories relating to the uniqueness of potash mining.   If interested, here is the link “Stories from 3000 Feet Down – Part 1“.


Note: If you would like to get notified when new blogs are posted, then sign up on the KJK mailing list on the website.  Otherwise I post notices on LinkedIn, so follow me at: https://www.linkedin.com/in/kenkuchling/.

 

Share