Disrupt Mining Challenge – Watch for it at PDAC

Update:  This blog was originally written in January 2016, and has been updated for Jan 2018.

Gold Rush Challenge

In 2016 at PDAC, Integra Gold held the first the Gold Rush Challenge.  It was an innovative event for the mining industry.  It was following along on the footsteps of the Goldcorp Challenge held way back in 2001.
The Integra Gold Rush Challenge was a contest whereby entrants were given access to a geological database and asked to prepare submissions presenting the best prospects for the next gold discovery on the Lamaque property.  Winners would get a share of the C$1 million prize.
Integra Gold hoped that the contest would expand their access to quality people outside their company enabling their own in-house geological team to focus on other exploration projects.   In total 1,342 entrants from over 83 countries registered to compete in the challenge.  A team from SGS Canada won the prize.

Then Disrupt Mining came along

In 2017, its seem the next step in the innovation process was the creation of Disrupt Mining sponsoerd by Goldcorp.  Companies and teams developing new technologies would compete to win a $1 million prize.
In 2017, the co-winning teams were from Cementation Canada (new hoisting technology) and Kore Geosystems (data analystics for decision making).
In 2018, the winning team was from Acoustic Zoom, an new way to undertake seismic surveys.

The 2019 winners will be announced at PDAC.  The entry deadline has passed so you’re out of luck for this year.

Conclusion

At PDAC there are always a lot of things to do, from networking, visiting booths, presentations, trade shows, gala dinners, and hospitality suites.
Now Disrupt Mining brings another event for your PDAC agenda.
Note: You can sign up for the KJK mailing list to get notified when new blogs are posted.
Share

Measured vs. Indicated Resources – Do We Treat Them the Same?

measured and indicated
(Orig 2016  Updated 2026) One of the first things we normally look at when examining a mineral resource estimate is how much of the resource is classified as Measured and Indicated (“M+I”) and then compare that to the Inferred tonnage.  It seems to be important to understand the uncertainty in the resource estimate and how much the Inferred contributes to the overall tonnage.  Sometimes we even break the rules and add together the M+I tonnage with the Inferred tonnage.
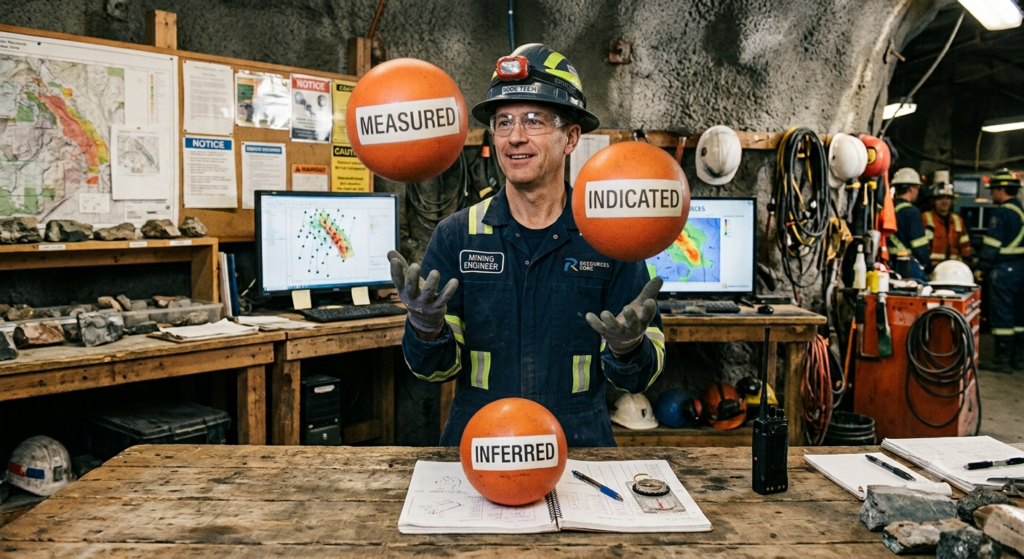
The mining engineer needs to juggle all three classifications.  Having said that, how much emphasis do we put on the split between the Measured and Indicated tonnages?   How much emphasis should be put on the Inferred resource by itself?

Inferred Resources Play a Role

We are all aware of the NI 43-101 restrictions imposed on the Inferred resources in mining studies.  They are deemed highly speculative, and hence cannot be used in the economic models for pre-feasibility and feasibility studies. However Inferred resource are used for pit design and production planing in a Preliminary Economic Assessment (“PEA”).
Inferred resources are so speculative that a company is not permitted to add them to the Measure and Indicated tonnages in a resource statement (although that is what every investor automatically does).   I don’t really understand that concern in a Mineral Resource statement if it clearly includes a line that adds M+I tonnage with Inferred tonnes – as long as everything is transparent.  It provides an easy way to see what portion of the total resource is Inferred.
Its a bit contradictory that when a PEA mining schedule is developed, the three resource classifications can be combined into a single tonnage value.  However in the Mineral Resource statement itself, the M+I+I cannot be totaled.
I understand that a company must provide information as to how much of the PEA production schedule is based on Inferred Resources, although often they do not provide this breakdown.  Next time you are reviewing a 43-101 report for a PEA, take a look if it is provided.

Are Measured Resources Important?

It appears to me that investors are often more interested in what resource tonnage meets the M+I threshold but are less focussed on the tonnage split between Measured and Indicated.
It seems that M+I are largely viewed as being somewhat the same.  Since both Measured and Indicated resources can be used in a pre-feasibility economic analysis, does it matter if the tonnage is 100% Measured (Proven) or 100% Indicated (Probable)?
The NI 43-101 and CIM guidelines provide definitions for Measured and Indicated Mineral Resources, but do not specify any different treatment like they do for the Inferred resources.   If Measured has more certainty than Indicated, should we be able to apply their tonnages interchangeably?
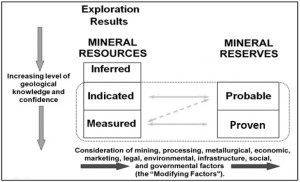
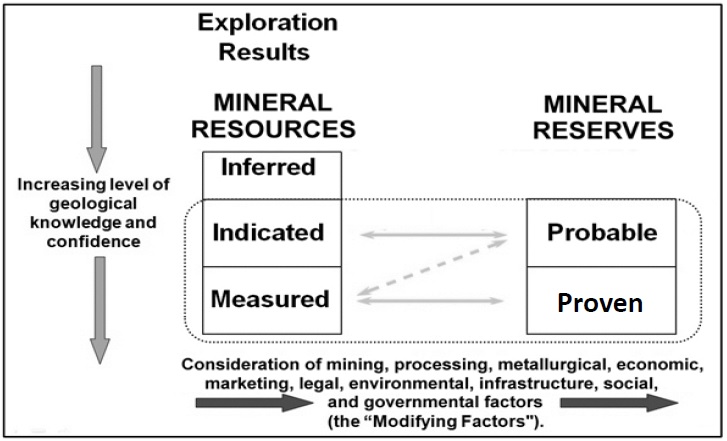
CIM Resources to Mineral Reserves

Relationship between Mineral Reserves and Mineral Resources (CIM Definition Standards).

In my experience with some feasibility studies, a few people did apply a  rule-of-thumb that the majority of the tonnage mined during the payback period must consist of higher confidence Measure resource (i.e. Proven reserve).
The idea was to reduce project risk by ensuring the production tonnage during the capital recovery period is mining the resource with the highest certainty in tonnes and grade.
Generally I do not see this requirement used that often anymore, although I am not aware of what everyone is doing in every study.  It would be good to see more  transparency on this in the studies.  Perhaps this may explain why some recent projects put into production had difficulty meeting grade targets and then ran into trouble.
I realize there is a cost, and possibly a significant cost, to infill drill to convert Indicated resource to Measured.  Hence there may be some hesitation in this approach. Likely it is simpler for everyone to just view the Measured and Indicated tonnages as one.  Note that some algorithyms are now available to help optimize infill drill programs to get the most bang for the buck (see this blog pot Let A.I. Help Target Your Infill Drilling).

Conclusion

NI 43-101 specifies how the Inferred resource can and cannot be used.  Given some of the project failures, is it a matter of time before the regulators start specifying how Measured and Indicated resources must be used?  There is  merit to this idea, however adding more regulation (and cost) to an already burdened industry would not be helpful. Ultimately it is up to the mining companies and financiers as to how far they want to see the re-risking step go.
In lieu of more regulations, perhaps in the interest of transparency, feasibility studies should add two new rows to the bottom of the production schedule. These rows would show how the annual mining and processing tonnages are split between Proven (Measured) and Probable (Indicated) categories. This would enable one to can get a sense of the resource risk in the early years of the project.
Given the capabilities of today’s mining software, it is not difficult to provide this additional detail.   Companies with a high proportion of Measured in their Feasibility Study can use this a way to promote their de-risking efforts.   Now we just need to ensure that the resource estimation consultants actually classify Measured as very high certainty resources.
I don’t want to give the impression that Inferred resources are unimportant.  They do play a role in mine design and permitting, as discussed in this post “The Double Life of Inferred Resources: Now You See It – Now You Don’t“.

************

Note: You can sign up for the KJK mailing list to get notified when new blogs are posted. Follow me on Twitter at @KJKLtd for updates and other mining posts.   The entire blog post library can be found at https://kuchling.com/library/
For some free mining calculator apps, including project timelines and a simplified cashflow modeller, check out this website https://sites.google.com/view/drillingdown
Share

3D Model Printing – Who To Contact?

One of the technologies that is still getting a lot of press is 3D printing.  It seems new articles appear daily describing some fresh and novel use. Everything from home construction, food preparation, medical supplies, and industrial applications, 3D printing continues to find new applications in a wide range of disciplines.

Mining can take advantage of 3D printing

In a previous blog “3D Printing – A Simple Idea”, I discussed the helpfulness of printing 3D topographic models for the team members of a mining study. I was recently contacted by a consulting firm in Texas that specializes in printing 3D mining models. Here is their story and a few model images as provided to me by Matt Blattman of Blattman Brothers Consulting. (www.blattbros.com/3dprinting)

Blattman Brothers Consulting

Their 3D printed models are used in the same way geologists and mining engineers have employed models for decades. In the past we saw the physical models made of stacked mylar or plexi-glass maps, wood or foam core. We recognized that there is value in taking two dimensional sections or plan maps and making a 3D representation.  This provides more information than those viewed on a computer screen.
Physical models convey scale, interactions and scope in ways that no other method can. Technology like 3D printing improves the model-making process by allowing the addition of high def orthophotos, reducing the model cost, increasing its precision and delivery time.
Currently 3D models can be made in a variety of materials, but the primary three are extruded plastic, gypsum powder, or acrylics.
  • Plastic models (ABS or PLA) are cheap, fast and can created on relatively inexpensive, hobbyist printers. The downside to these models is that the number of colors available in a single model are limited, typically a single color.
  • Powder-based printers can typically print in 6.5M colors, allowing for vibrant, photo-realistic colors and infinite choices for title blocks, logos and artistic techniques. However, gypsum models can be as fragile as porcelain and require some care in handling.
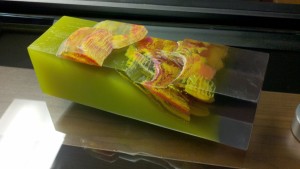
  • Acrylic models allow for translucent printing (“looking into the ground to see the geological structure”) and are more durable than the gypsum. Nevertheless, acrylic models are significantly more expensive than the other two types and the color palettes are limited.
Here are some examples.
Leapfrog Model

Leapfrog Model

Geological Model in Acrylic

Acrylic Model

Powder Based 3D Model

Powder Based 3D Model

Powder Based 3D Model

Powder Based 3D Model

Besides having another toy on your desk beside your stress ball, why not print off your mine plan, or print the geology shapes and topography? It’s all about communicating highly technical data to a non-technical audience, whether that audience is a permitting authority, the general public, or maybe even company management.
The ability to grasp a map or technical drawing is a learned skill and not everyone has it. If you’ve just spent $20M on a feasibility study, why assume that the attendees in a public meeting will fully appreciate the scale and overall impact of your proposed project with 2D maps?
That message can be better conveyed with a model that is easily understood. One of Blattman’s clients, Luck Stone, recently described how they use their 3D printed models in this video.

Blattman’s models are created from the same 3D digital data already in use by most companies involved in geological modeling and mine design. Other than the units (meters versus millimeters), the triangulated surfaces created by the software are no different than those created by mechanical or artistic 3D modeling programs.
While many 3D printing services are available on the market, not all of them are able to speak “mining”. They may not be able to walk the skilled geologist or mining engineer through the process of creating the necessary digital formats and that’s where Blattman comes in. With more than 20 years of mining experience and having already gone through the 3D printing learning curve, they can assist any natural resource company through the process, either as a full-service/turn-key project or just to advise the client on how to prepare their own files.

Conclusion

The bottom line is that 3D printing is here to stay and its getting better each year.   Go ahead and check out the technology to see if it can advance your path forward .
We would be interested in hearing about any experiences your have had with 3D modelling, pro’s and con’s.
Note: You can sign up for the KJK mailing list to get notified when new blogs are posted.
Share

New Mining Software and 43-101 Legal Issues

43-101 issues
NI 43-101 puts a fair amount of legal liability on the Qualified Person preparing a resource or reserve estimate or sign off on an advanced study.  The QP is to be responsible for the accuracy of their work and take legal responsibility.
Every so often some new mining software comes along and I often wonder what are the risks in using it? Some examples of new mining software that I have heard about (but not personally used) nor have seen mentioned in any 43-101 studies are SimSched, the ThreeDify’s software packages, NPV One, and Bentley.

Is the software doing everything correctly?

Given that as a QP I am legally responsible for my work, I am  bit apprehensive about how I can be assured the new software will provide reliable and accurate results for which I accept legal liability.  The last thing I would want to do is issue a public technical report which is found to be in error due to a software bug.
Irrespective of 43-101, if you are working at a mining operation the last thing you want to do is present management with an incorrect reserve, pit design, or production plan.
If you are a consultant, how agreeable will your client be when you tell him that his study was done using a novel software package and not one of the industry standard packages, and there was an error in it?
I recall working with a major mining company and there was a reluctance to adopt any new software that was unproven and not an industry standard.  Money was not the issue; the company’s concern  was with the risk in using unproven software.

What if you have a limited budget?

How do you view new software if you have a limited budget?   The new software may be cheaper, may appear to be be great, and may be a technological improvement and all at a lower cost.  However the software risk still remains.  There is no guarantee that all software output is correct simply because it comes from a computer.
As a QP, I suggest the onus is on the software developers to demonstrate that they can produce reliable and comparable results under all conditions.  They need to be able to convince the future users that their software is accurate.

Perhaps over time the new software will gain wider adoption and be generally accepted.  We may see more 43-101 reports that use it and hence it will get more overall acceptance.
Another question when developing a market for new software is whether it is better to focus on more consultant adoption or more mining company adoption?
Will mining companies use the software if their consultants are using it, or will consultants use it if more companies adopt it?  It’s an interesting discussion that new software vendors must deal with in trying to grow their market share.


Note: If you would like to get notified when new blogs are posted, then sign up on the KJK mailing list on the website. The entire blog post library can be found at this LINK with topics ranging from geotechnical, financial modelling, and junior mining investing.
Share

Mining Project Economics – Simple 1D Model

mining desktop study
In a previous article I outlined my thoughts on the usefulness of early stage financial modelling (“Early Stage “What-if” Mine Economic Analysis – Its Valuable”).     My observation was that it is useful to take a few days to build a simple cashflow model to help your team better understand your project.

By “simple” I mean really simple.

This blog describes one of the techniques that I use to take a super-quick look at any project; whether it is for a client wishing to understand his project at a high level; or whether it is a project that I have read about.  There isn’t any actual study or production schedule available yet.  Maybe there is only a mineral resource estimate available.
It takes about 10 minutes to plug the numbers into my template to get fast results.  The image below is an example of the simple model that I use, but anyone can build one for themselves.

Screenshot of Simple Economic Model

I use the term one dimensional (“1D”) model since it doesn’t use the typical X-Y matrix with years across the top and production data down the page.
The 1D model simply relies simple on life of mine (“LOM”) totals to estimate the total revenue, total operating cost, and total profit.  This determines how much capital expenditure the project can tolerate.
The only caveat is that you need to have some sense for operating and capital costs for similar projects. This analysis can be on both a pre-tax and simple after-tax basis.
Using estimated metal prices and recoveries, the first step is to calculate the incremental revenue generated by each tonne of ore (see a previous article “Ore Value Calculator – What’s My Ore Worth?”).
Next that revenue per tonne is multiplied by the total ore tonnage to arrive at the total revenue over the life of mine.
The second step is to determine the life of mine operating cost, and again this simple calculation is based on estimated unit operating costs multiplied by the total tonnages being handled.
The third step is to calculate the life of mine profit based on total revenue minus total operating cost.
The potential net cashflow would be calculated by deducting an assumed capital cost from the life-of-mine profit.  The average annual cashflow is estimated based on the net cashflow divided by the mine life.  An approximate NPV can be calculated by determining the Present Value of a series of annual payments at a certain discount rate.
The reasonableness of the 1D model will be examined via benchmarking and this will be summarized once completed.  I will include a link to that future blog here.

You need to understand your project

One can easily evaluate the potential impact of changing metal prices, changing recoveries, ore tonnages, operating costs, etc. to see what the economic or operational drivers are for this project.  This can help you understand what you might need in order to make the project viable.

Conclusion

The bottom line is that a 1D economic calculation is very simplistic but still provides a vision for the project.  The next step in the economic modelling process would be a 2D model based on an annual production schedule.  The 1D approach is just a quick first step in looking at the potential.  You can do it even when you only know the head grades and some generalized orebody information.
The two ways you can apply the simple 1-D model are:
  1. evaluate the potential of early stage projects using cost inputs from other studies,
  2. examine a project’s sensitives (units costs, recoveries, prices) by calibrating your simple model to the published study (i.e. use the same parameters and make changes as needed.
The entire blog post library can be found at this LINK with topics ranging from geotechnical, financial modelling, and junior mining investing.


Note: If you would like to get notified when new blogs are posted, then sign up on the KJK mailing list on the website.  
Share

Large or Small Mining Consulting Firms – Any Difference?

Mining feasibility pre-feasibility
Some junior mining companies select their mining study consultant based on the assumption that they need a “big name” firm to give credibility to their study.   This creates an interesting dilemma for many smaller mining companies since they the larger firms can cost more.  Its also a dilemma for smaller engineering firms trying to win jobs.  While large consultants may cost more due to higher overheads; their brand name on a study may bring some value.
In my personal experience I find that larger consultants are best suited for managing the large scale feasibility studies.  This isn’t because they necessarily provide better technical expertise.  Its because they generally have the internal project management and costing systems to manage the complexities of such larger studies.
The larger firms are normally able to draw in more management resources; for example, project schedulers, cost estimators, and document control personnel.  Ultimately one will pay for all of these people, albeit they may be a critical part in successfully completing the study.
A feasibility study is more rigorous than a pre-feasibility study, which in turn is more rigorous than a PEA or scoping study.

Sub-contracting Parts

For certain aspects of a feasibility study, one may get better technical expertise by subcontracting to smaller highly specialized engineering firms.  However too much subcontracting may become an onerous task.  Often the larger firms may be better positioned to do this.
In my view, likely the best result will come from a combination of a large firm managing the feasibility study but undertaking only the technical aspects for which they are deemed to be experts.
The large lead firm would be supported by smaller firms for the specialized aspects, as per a previous article “Multi-Company Engineering Studies Can Work Well..Or Not”.

What about smaller studies?

For smaller studies, like scoping studies (i.e. PEA’s), which can be based on limited amounts of technical data, I  don’t see the need to award these studies to large engineering firms.  The credibility of such early studies will be linked to the amount of data used to support the study.  For example, there may be limited metallurgical testing, or limited geotechnical investigations; or the resource is largely inferred.
Not all PEA’s are equal (see “PEA’s – Not All PEA’s Are Created Equal”).  A large firm’s application of limited data may be no more accurate or defensible than a small firm’s use of the same data.
One of the purposes of an early stage study is to see if the project has economic merit and would therefore warrant further expenditures in the future.  An early stage study is (hopefully) not used to defend a production decision.  The objective of an early stage study is not necessarily to terminate a project (unless it is obviously highly uneconomic).
I have seen instances where larger firms, protecting themselves from  limited data, were only willing to use very conservative design assumptions in early stage mining studies. This may not be helpful to a small mining company trying to decide how to advance such a project.

Conclusion

The bottom line is that for early stage studies like a PEA, smaller engineering firms can do as good a job as larger firms.  However one must select the right firm.  Review some of their more recent 43-101 reports to gauge their quality of work.  Don’t hesitate to check with previous client references.
For the more advanced feasibility level studies, be wary if a smaller firm indicates they can do the entire study. Perhaps they can be responsible for some parts of the feasibility study as a sub-contractor to a larger firm. Managing these large study may be beyond their experience and internal capabilities.
Whether you are considering a small or large engineering firm, know their strengths and weaknesses as they will relate to the specific’s of your study.
In another blog post I have expanded the discussion about the importance of the study manager role. You can read that post at this link “Importance of a Study Manager – That’s the Key“.
Another blog post discusses undertaking studies using multiple engineering teams and the pitfalls to watch out for.  That blog post is at “Multi-Company Mining Studies Can Work Well…or Not“.
Note: You can sign up for the KJK mailing list to get notified when new blogs are posted.
Share