Articles tagged with: Cashflow Model

Global Tax Regimes – How Do They Compare?

mining economics
Update: This blog was originally written in Feb 2016, but has been updated in Aug 2019.
As a reminder for all QP’s doing economic analysis for PEA’s, don’t forget that one needs to present the economic results on an after-tax basis.
Every once in a while I still see PEA technical reports issued with only pre-tax financials.  That report is likely to get red- flagged by the securities regulators.  The company will need to amend their press release and technical report  to provide the after tax results.    No harm done other than some red faces.

Taxes can be complicated

When doing a tax calculation in your model, where can you find international tax information?  PWC has a very useful tax-related website.  The weblink below was sent to me by one of my industry colleagues and I thought it would be good to share it.
The PWC micro-site provides a host of tax and royalty information for selected countries.  The page is located at https://www.ey.com/gl/en/services/tax/global-tax-guide-archive
On the site they have a searchable database for tax information for specific countries.
The PWC tax and financial information includes topics such as:
  • Corporate tax rates
  • Excess profits taxes
  • Mineral taxes for different commodities
  • Mineral royalties
  • Rates of permissible amortization
  • VAT and other regulated payments
  • Export taxes
  • Withholding taxes
  • Fiscal stability agreements
  • Social contribution requirements
PWC has a great web site and hopefully they will keep the information up to date since tax changes happen constantly.  The website also has a guide related to the rules for the treatment of capital expenditures.   Check it out.  https://www.ey.com/gl/en/services/tax/global-tax-guide-archive
Note: If you would like to get notified when new blogs are posted, then sign up on the KJK mailing list on the website.  Otherwise I post notices on LinkedIn, so follow me at: https://www.linkedin.com/in/kenkuchling/.
Share

Claim Fees Paid for a Royalty Interest – Good Deal or Not?

mineral property acquisition
In 2016 I read several articles about how the junior mining industry must innovate to stay relevant.    Innovation and changing with the times are what is needed in this economic climate.
One company that was trying something new is Abitibi Royalties.  They were promoting a new way for them to acquire royalty interests in early stage properties.  They were offering to fund the claim fees on behalf of the property owner in return for a royalty.
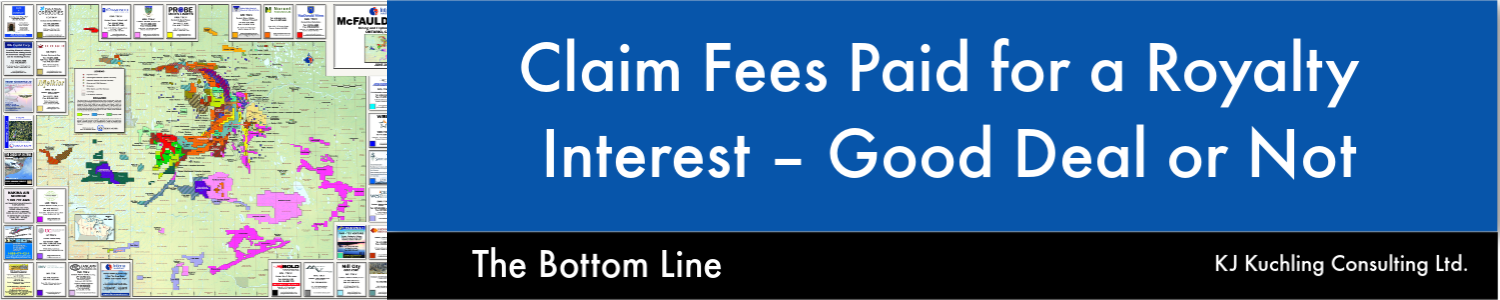
Their corporate website states that they would pay, for a specified period of time, the claim fees/taxes related to existing mineral properties or related to the staking of new mineral properties.
In return, Abitibi Royalties would be granted a net smelter royalty (“NSR”) on the property.  It may be a gamble, but it’s not a high stakes gamble given the relatively low investment needed.

Not just anywhere

Abitibi were specifically targeting exploration properties near an operating mine in the Americas. They were keeping jurisdiction risk to a minimum.   Abitibi stated that their due diligence and decision-making process was fast, generally within 48 hours.  No waiting around here but likely this is possible due to the low investment required and often the lack of geological information to do actually do a due diligence on.
To give some recent examples, in a December 14, 2015 press release, Abitibi state that the intend to acquire a 2% NSR on two claims in Quebec and will pay approximately $11,700 and reimburse the claim owner approximately $13,750 in future exploration expenses. This cash will be used by the owner towards paying claim renewal fees and exploration work commitments due in 2016.   Upon completion of the transaction, these will be the ninth and tenth royalties acquired through the Abitibi Royalty Search.  For comparison, some of their other royalty acquisitions cost were in the range of $5,000 to $10,000 each (per year I assume).   I think that those NSR interests are being acquired quite cheaply.
The benefit to the property owner may be twofold; they may have no other funding options available and they are building a relationship with a group that will have an interest in helping the project move forward.  The downside is that they have now encumbered that property with a NSR royalty going forward.
The benefit to Abitibi Royalties is that they have acquired an early stage NSR royalty quite cheaply although there will be significant uncertainty about ever seeing any royalty payments from the project.   Abitibi may also have to continue to make ongoing payments to ensure the claims remain in good standing with the owner.
It’s good to see some degree of innovation at work here, although the method of promotion for the concept may be more innovative than the concept itself. Unfortunately these Abitibi cash injections investments are not enough to pay for much actual exploration on the property and this is where the further innovation is required, whether through crowd funding, private equity, or some other means.   I’m curious to see if other companies will follow the Abitibi royalty model but extend it to foreign and more risky properties.
Note: You can sign up for the KJK mailing list to get notified when new blogs are posted.
Share

Mining Cashflow Sensitivity Analyses – Be Careful

cashflow sensitivity
One of the requirements of NI 43-101 for Item 22 Economic Analysis is “sensitivity or other analysis using variants in commodity price, grade, capital and operating costs, or other significant parameters, as appropriate, and discuss the impact of the results.”
The typical result of this 43-101 requirement is the graph seen below (“a spider graph”, which is easily generated from a cashflow model.  Simply change a few numbers in the Excel file and then you get the new economics.  The standard conclusions derived from this chart are that metal price has the greatest impact on project economics followed by the operating cost.   Those are probably accurate conclusions, but is the chart is not telling the true story.
DCF Sensitivity GraphI have created this same spider graph in multiple economic studies so I understand the limitations with it.   The main assumption is that all of the sensitivity economics are based on the exact same mineral reserve and production schedule.
That assumption may be applicable when applying a variable capital cost but is not applicable when applying varying metal prices and operating costs.
Does anyone really think that, in the example shown, the NPV is $120M with a 20% decrease in metal price or 20% increase in operating cost?   This project is still economic with a positive NPV.
In my view, a project could potentially be uneconomic with such a significant decrease in metal price but that is not reflected by the sensitivity analysis.  Reducing the metal price would result in a change to the cutoff grade.  This changes the waste-to-ore ratio within the same pit.  So assuming the same size mineral reserve is not correct in this scenario.
Changes in economic parameters would impact the original pit optimization used to define the pit upon which everything is based.
A smaller pit size results in a smaller ore tonnage, which may justify a smaller fleet and smaller processing plant, which would have higher operating costs and lower capital costs.
A smaller mineral reserve would produce a different production schedule and shorter mine life.  It can  get quite complex to examine it properly.
Hence the shortcut is to simply change inputs to the cashflow model and generate outputs that are questionable but meet the 43-101 requirements.
The sensitivity information is not just nice to have.   Every mining project has some flaws, which can be major or minor. Management understandably have a difficult task in making go/no-go decisions. Financial institutions have similar dilemmas when deciding on whether or not to finance a project.   You can read that blog post at this link “Flawed Mining Projects – No Such Thing as Perfection
So if the spider chart isnt he best way to tackle the risk issue, what way is better?  In another blog post I discuss an different approach using the probabilistic risk evaluation (Monte Carlo).  Its isn’t new but now well adopted yet by the mining industry.  You can learn more at “Mining Financial Modeling – Make it Better!
Note: If you would like to get notified when new blogs are posted, then sign up on the KJK mailing list on the website.   
Share

Junior Mining – Are People Still Investing?

small mining companies
Update: This blog was originally written in June 2015, however many of the observations made then still hold in late 2018.
The general consensus over the last couple of years is that the junior mining sector is still in a state of flux.
I briefly touched on this in a previous article “12. Financings – It Helps to Have a Credible Path Forward”.
It is still difficult for junior miners to get funding and the stock prices of have been on a downward trend.   Some observers say this just a temporary phase and the stock prices will cycle, as they have in the past.   I’m not convinced that this will be the case, although I am hoping.

Metal prices may recover, but will stock prices?

I am reasonably confident that metal prices will improve over time, but I am not sure that alone will result in the junior mining sector invigorating.  I think there is a long term shift in how personal investments are being made and how the mining industry is being viewed.  The following blog has some personal opinions on the present and the future.
Mining companies are constantly in the media with stories of cost over-runs, mine shutdowns, fatalities, strikes & protests, and environmental incidents.
In addition, the junior mining sector has had a few notable scams that nobody ever forgets about.
In some instances management were over promoting sub-optimal projects simply for the purpose of raising the stock price and cashing out.  Not many companies fell into this category, but enough to create an unfavorable image of the industry.
I think it will take time to recover from the image being created by the events described above. Unfortunately new incidents only build on the perceived legacy.
The implementation of sustainable and green mining practices is an attempt to rehabilitate the image of mining, but is anyone out there listening?

Are investment practices changing?

Regarding today’s investment practices, I have three general observations:
  1. Yield Investors: When many of us baby boomers were younger with a steady job, we were willing to speculate on mining stocks hoping for the big payoff.  At the time there were some well publicized payoffs. Also there wasn’t much else to speculate on.
    Now those same baby boomers are moving into retirement and financial planners are push them into fixed income and dividend paying investments.  Be happy with a 2% to 5% yield.  The risk tolerance for many of these investors has shifted from speculation / growth to income / capital retention.
    I’m not sure how many of these people will ever re-enter the mining stock market.  The majority of miners don’t pay any significant yield.   Looking at the yield for Barrick (2%), Goldcorp (0.8%), and Yamana (0.85%), their yields are lower than those for the more conservative bank stocks (4%-6%).
  1. Where to speculate now?  Where might the 30 to 40 year old’s speculate today? Younger people today may still speculate with their free cash, but they are not hoping to be investors in the next Voisey’s Bay, Kidd Creek, or Hemlo.  They have never even heard of them.
    They are hoping to be investors in the next Apple, Google, or Facebook, or a cannabis company.  The dot.com bubble of 1999–2000 was a case of junior mining speculators jumping into technology and it was a bust.  However currently several of the new breed of dot.com companies that have IPO’d are getting huge share price increases.  Is it still a tech bubble? Not so much anymore.
    I don’t know whether the younger speculators will ever have interest in the mining sector since they never heard of it.  There is so much other investing activity happening out there.
  2. The perception of mining: The mining and energy news shown in the media is not helping the industry by focusing mainly on the negative aspects. The resource business appears to be somewhat analogous to the meat industry. Everyone likes their nicely packaged rows of chicken and beef at the grocery store but nobody wants to see how it actually gets to the store.  Everyone also loves their metallic gadgets and the energy used to power them, but please don’t show how it actually gets from mine to store shelf.  It can be quite upsetting.
  3. Complexity:  To invest in a mining stock or understand a mining IR presentation, one needs a basic understanding of mining and geology.   To understand a tech stock or bank stock, one does not need to be an expert in that industry. People will intuitively have a better comfort level with them.

Can mining companies provide more yield?

An interesting group of companies are the mid tier producers that have operating mines and generate profits, but do not pay a dividend.  I will be curious to see how these companies shares will perform since they don’t satisfy the yield investor nor may they satisfy the pure speculator looking for order of magnitude capital gains.
The larger mining companies will always have their investors like pension funds and mutual funds, however the junior miners may be a different story.
Possibly private equity and equity-based crowdfunding will be one of the long term solutions.
I have heard of one geological consulting firm that was trying to foster a plan to help crowdfunders with their 43-101 report even though they don’t yet have the money to pay for the report.
I also understand that Canada now has a few private equity stock exchanges that allow PE to change hands, which may facilitate more private equity involvement.

Conclusion

The bottom line is the mining industry needs to have a self-examination with respect to what the future holds.  There is talk that mining needs to change its business model, but very little suggestion regarding what changes to make.
The growing population changing demographics, competition for equity funding, and society’s urbanization may result in fundamental, and permanent, changes to how the financial side of the junior mining industry can function.  Just my opinion.
Note: If you would like to get notified when new blogs are posted, then sign up on the KJK mailing list on the website.  Otherwise I post notices on LinkedIn, so follow me at: https://www.linkedin.com/in/kenkuchling/.
Share

Mining Project Economics – Simple 1D Model

mining desktop study
In a previous article I outlined my thoughts on the usefulness of early stage financial modelling (“Early Stage “What-if” Mine Economic Analysis – Its Valuable”).     My observation was that it is useful to take a few days to build a simple cashflow model to help your team better understand your project.

By “simple” I mean really simple.

This blog describes one of the techniques that I use to take a super-quick look at any project; whether it is for a client wishing to understand his project at a high level; or whether it is a project that I have read about.  There isn’t any actual study or production schedule available yet.  Maybe there is only a mineral resource estimate available.
It takes about 10 minutes to plug the numbers into my template to get fast results.  The image below is an example of the simple model that I use, but anyone can build one for themselves.

Screenshot of Simple Economic Model

I use the term one dimensional (“1D”) model since it doesn’t use the typical X-Y matrix with years across the top and production data down the page.
The 1D model simply relies simple on life of mine (“LOM”) totals to estimate the total revenue, total operating cost, and total profit.  This determines how much capital expenditure the project can tolerate.
The only caveat is that you need to have some sense for operating and capital costs for similar projects. This analysis can be on both a pre-tax and simple after-tax basis.
Using estimated metal prices and recoveries, the first step is to calculate the incremental revenue generated by each tonne of ore (see a previous article “Ore Value Calculator – What’s My Ore Worth?”).
Next that revenue per tonne is multiplied by the total ore tonnage to arrive at the total revenue over the life of mine.
The second step is to determine the life of mine operating cost, and again this simple calculation is based on estimated unit operating costs multiplied by the total tonnages being handled.
The third step is to calculate the life of mine profit based on total revenue minus total operating cost.
The potential net cashflow would be calculated by deducting an assumed capital cost from the life-of-mine profit.  The average annual cashflow is estimated based on the net cashflow divided by the mine life.  An approximate NPV can be calculated by determining the Present Value of a series of annual payments at a certain discount rate.
The reasonableness of the 1D model will be examined via benchmarking and this will be summarized once completed.  I will include a link to that future blog here.

You need to understand your project

One can easily evaluate the potential impact of changing metal prices, changing recoveries, ore tonnages, operating costs, etc. to see what the economic or operational drivers are for this project.  This can help you understand what you might need in order to make the project viable.

Conclusion

The bottom line is that a 1D economic calculation is very simplistic but still provides a vision for the project.  The next step in the economic modelling process would be a 2D model based on an annual production schedule.  The 1D approach is just a quick first step in looking at the potential.  You can do it even when you only know the head grades and some generalized orebody information.
The two ways you can apply the simple 1-D model are:
  1. evaluate the potential of early stage projects using cost inputs from other studies,
  2. examine a project’s sensitives (units costs, recoveries, prices) by calibrating your simple model to the published study (i.e. use the same parameters and make changes as needed.
The entire blog post library can be found at this LINK with topics ranging from geotechnical, financial modelling, and junior mining investing.


Note: If you would like to get notified when new blogs are posted, then sign up on the KJK mailing list on the website.  
Share

Ore Value Calculator – What’s My Ore Worth?

rock economic value
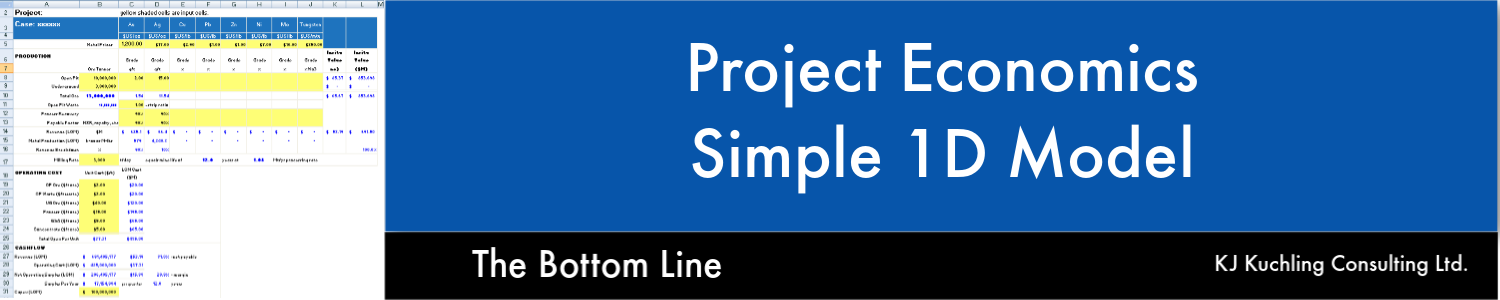
In my view, one of the most important things you need to understand about your orebody is the insitu rock value. Hopefully it is economic, i.e. an ore value.  Its the key driver in shaping the economics of any mining project.
The two main nature-driven factors in the economics of a mining project are the ore grade and the ore tonnage.  In simplistic terms, the ore grade will determine how much incremental profit can be generated by each tonne of rock processed.
The ore tonnage will determine whether the cumulative profit generated all the ore will be sufficient to pay back the project’s capital investment plus provide some reasonable profit to the owner.

Does the Ore Grade Generate a Profit ?

In order to understand the incremental profit generated by each ore tonne one must first convert the ore grade into a revenue dollar value.   This calculation will obviously depend on metal prices and the amount of metal recovered.  For some deposits with multiple metals, the total revenue per tonne will be based on the summation of value contributed by each metal. Some metals may have different process recoveries and different net smelter payable factors, so several factors come into play.
To help calculate the value of the insitu ore, I have created a simple cloud-based spreadsheet at this link (Rock Value Calculator).  An example screenshot is shown below.  Simply enter your own data in the yellow shaded cells and the rock values are calculated on a “$ per tonne” basis. since the table is pre-populated, one must zero out the values for metals of no interest.


Rock Value Calculator Pic

Price: represents the metal prices, in US dollars for the metals of interest.
Ore Grade: represents that head grades for the metals of interest in the units as shown (g/t and %).
Process Recovery: represents the average % recovery for each of the metals of interest.
Payable Factor: represents the net payable percentage after various treatment, smelting, refining, penalty charges.  This is simply an estimate depending on the specific products produced at site.  For example, concentrates would have an overall lower payable factor than say gold-silver dore production.
Insitu Rock Value: this output is the dollar value of the insitu rock (in US dollars), without any process recovery or payable factors being applied.
NSR Rock Value: this output represents the net smelter return dollar value after applying the recovery and payable factors.  This represents the actual revenue that could be generated and used to pay back operating costs.  One can see the impact that these payables have on the overall value.

Mining Profit = Revenue – Cost

The final profit margin will be determined by subtracting the mine operating cost from the NSR Rock Value.  These operating costs would include mining, processing, G&A, and some offsite costs.  Typically large capacity open pit operations may have total operating costs in the range of $10-15/tonne, while conventional hardrock underground operations would be much higher ($50->$100/t).

Conclusion

The bottom line is that very early on one should understand the net revenue that your project’s head grades may deliver.   How valuable is the rock?   It is a fairly simple calculation to undertake.
You can even start evaluating the rock at the exploration drilling stage.  I have a cloud-based calculator for this at the link “Drill Intercept Analysis“.  This calculator is a bit more complex than the Rock Value Calculation but relies on inputting drill intercept data.
Ore value will give sense for whether its a high margin project or whether the ore grades are marginal and higher metal prices or low operating costs will be required. The earlier one understands the potential economics of the different ore types, the better one will be able to visualize, design, and advance the project.
For gold deposits, I have another blog post that discusses grades, values, and how they related to open pit or underground mining costs.  Low grade narrow intervals like have much less economic potential than wide low grade interval or narrow high grade gold intervals. You can read that post at this link “Gold Exploration Intercepts – Interesting or Not?


Note: If you would like to get notified when new blogs are posted, then sign up on the KJK mailing list on the website.  Otherwise I post notices on LinkedIn, so follow me at: https://www.linkedin.com/in/kenkuchling/.


Share

4 Mining Study Types (Concept to Feasibility)

Over my career I have been involved in various types of mine studies, ranging from desktop conceptual to definitive feasibility.    Each type of study has a different purpose and therefore requires a different level of input and effort, and can have hugely different costs.
I have sat in on a few junior mining management discussions regarding whether they should be doing a PEA or a Pre-Feasibility Study, or a Feasibility instead of a Pre-Feasibility Study.    Everyone had their opinion on how to proceed based on their own reasoning.   Ultimately there is no absolute correct answer but there likely is one path that is better than the others.  It depends on the short term and long term objectives of the company, the quality and quantity of data on hand, and the funding available.

4 types of mining studies

In general there are 4 basic levels of study, which are listed below.  In this blog I am simply providing an overview of them.  On the web there are detailed comparison tables, but anyone can contact me at KJKLTD@rogers.com for an a full copy of my table (an excerpt is shown below).

Four Studies Table

1. Desktop or Conceptual Mining Study
This would likely be an in-house study, non-43-101 compliant, and simply used to test the potential economics of the project.  It lets management know where the project may go (see a previous blog at the link “Early Stage “What-if” Economic Analysis – How Useful Is It?”.    I always recommend doing a desktop study, and preparing some type of small internal document to summarize it.  It doesn’t take much time and is not made public so the inputs can be high level or simply guesses.  This type of early stage study helps to frame the project for management and lets one test different scenarios.
2. Preliminary Economic Assessment (“PEA”)
The PEA (or scoping study) can be 43-101 compliant and present the first snapshot of the project scope, size, and potential economics to investors.  Generally the resource may still be uncertain (inferred classification), capital and operating costs are approximate (+/- 40%) since not all the operational or environmental issues are known at this time.   Avoid promoting the PEA as an “almost” feasibility level study.

Don’t Announce a PEA Until You Know the Outcome

I recommend not announcing the start of a PEA until you are confident in what the outcome of that PEA will be.   A reasonable desktop study done beforehand will let a company know if the economics for the PEA will be favorable.  I have seen situations where companies have announced the start of a PEA and then during the course of the study, things not working out economically as well as envisioned.  The economics were poorer than hoped and so a lot of re-scoping of the project was required.  The PEA was delayed, and shareholders & analysts negative suspicions were raised in the meantime.
The PEA can be used to evaluate different development scenarios for the project (i.e. open pit, underground, small capacity, large capacity, heap leach, CIL, etc.).  However the accuracy of the PEA is limited and therefore I suggest that the PEA scenario analysis only be used to discard obvious sub-optimal cases.  Scenarios that are economically within a +/-30% range of each other many be too similar to discard at this PEA stage.  This is where the PFS comes into play.
3. Pre-Feasibility Study (“PFS”)
The PFS will be developed using only measured and indicated resources (no inferred resource used) so the available ore tonnage may decrease from a previous PEA study.  The PFS costing accuracy will be greater than a PEA.  Therefore the PFS is the proper time to evaluate the remaining mine development scenarios.  Make a decision on the single path forward going into the Feasibility study.

Use the PFS to determine the FS case

More data will be required for the FS, possibly a comprehensive infill drilling program to upgrade more of the the resource classification from inferred to indicated.  Many companies, especially those with smaller projects might skip the PFS stage  entirely and move directly to Feasibility.  I don’t disagree with this approach if the project is fairly simple and had a well defined scope at the PEA stage.
4. Feasibility Study (“FS”)
The Feasibility Study is the final stage study prior to making a production decision.  The feasibility study should preferably be done on a single project scope.  Try to avoid more scenario option analysis at this stage.
Smaller companies should be careful when entering the FS stage.  Once the FS is complete, shareholders will be expecting a production decision.  If the company only intends to sell the project with no construction intention, they have now hit a wall.  What to do next?

Sometimes management feel that a FS may help sell the  project.

I don’t feel that a FS is needed to attract buyers and sell a project.  Many potential buyers will do their own in-house due diligence, and possibly some alternate design and economic studies.   Likely information from a PFS would be sufficient to give them what they need.  A well advanced Environmental-Socio Impact Assessment may provide more comfort than a completed Feasibility Study would.

Conclusion

executive meetingMy final recommendation is that there is no right answer as to what study is required at any point in time.  Different paths can be followed but consideration must be given to future plans for the company after the study is completed.   Also consider what is the best use of shareholder money?
Company management may see pressure from retail shareholders, major shareholders, financial analysts, and the board of directors to “do a study”.  Management must decide which mining study path is in the best longer term interests of the company.  Maybe no study is warranted.
Note: If you would like to get notified when new blogs are posted, then sign up on the KJK mailing list on the website. Follow us on Twitter at @KJKLtd for updates and insights.
Share

Early Stage “What-if” Mine Economic Analysis – Its Valuable

Mining study economics
Over my career I have worked with large and small mining companies and seen how they studied projects and potential acquisitions.
Large mining companies have their in-house evaluation teams that will jump on a potential opportunity that comes around and start examining it quickly.  These evaluation teams may consist of a specialized head office group supported by people temporarily pulled in from their mining operations.
They are experienced at what they do and can provide management with solid advice even if working with only limited data.  This help management decide very early on whether to further pursue the opportunity or walk away immediately.
Early stage economics are normally part of this evaluation approach.   Although they are not correct all of the time, more than often they save their company from wasting money on projects unlikely to fly.
However if you are a small mining company, what are your options?
You don’t have an in-house technical team sitting around ready to go.  Management still needs to know if this project has a chance.  If the project is early stage, sometimes management thinks its fine to take a gamble, acquire the project, and then put money into the ground rather than spending on early studies.

It is possible to do both

Management and the exploration team usually have a vision for their projects, even those projects with only limited information.   Each person may have a different opinion on the potential size and scope of what may ultimately exist there.  However the question is whether any of those visions have sufficient accuracy to warrant spending more shareholder money on the project.
Some of the junior mining management teams that I have worked with have found it beneficial early on to have a basic internal cashflow model on hand.   If properly constructed, these are simple to tweak to examine “what-if’s” scenarios.  Input the potential deposit size and mine life, potential head grades, expected metallurgy, and typical costs to see what the economic outcome is.  Does this project have a chance and, if not, what tonnage, head grade, recovery, or metal price is required to make it work?   The simple cashflow model can tell you all of this.

Early stage modelling adds value

The tangible benefits to very early financial modelling are:
  • It helps management to conceptualize and understand their project.  If done honestly, it will reveal both the opportunities and threats to success.
  • It helps management to understand what technical parameters will be most important for them to resolve and what technical factors can be viewed as secondary. This helps guide the on-going exploration and data collection efforts.
  • Periodically refreshing the economic model with new information will reveal if the economic trends are getting better or worse.

Its not 43-101 compliant

I must caution that this type of early stage economic analysis is not 43-101 compliant and hence can not be shared externally, no matter how much one might wish to.
Another caution is that in some cases these early stage un-engineered projections become “cast in stone”, with management treating them as if they are accurate estimates.  Then suddenly all subsequent advanced studies must somehow agree with the original cost guesses, thereby placing unreasonable expectations on the project and the people doing the work.
The early stage economic models can consist of simple one-dimensional tables using life-of-mine tonnages or two-dimensional tables showing assumed annual production by year.  Building simple cashflow models may take only 2-3 days of effort.  That is not an onerous exercise compared to the overall benefit they can provide.
The bottom line is that it is useful to take a few days to develop a simple cashflow model.  “Simple” also means that management themselves can tweak the models and don’t need to be modeling expert on hand at all times.  “Simple” means the model should be well.  In another block post I discuss why to avoid demonstrating one’s Excel skills in building models. Read more on that at this link  Financial Spreadsheet Modelling – Think of Others.
Most companies have a CFO that can easily undertake this type  of modelling, with the help of some technical input.  Be careful though, often CFO’s take the simple cashflow model to an unwarranted level of complexity.
The simplest of all models is the one-dimensional approach.  To learn more about the concept behind a simple 1D financial models, read the blog post “Project Economics – Simple 1D Model” .
The entire blog post library can be found at this LINK with topics ranging from geotechnical, financial modelling, and junior mining investing.
Note: If you would like to get notified when new blogs are posted, then sign up on the KJK mailing list on the website.  Otherwise I post notices on LinkedIn, so follow me at: https://www.linkedin.com/in/kenkuchling/.
Share

Mine Financial Modelling – Please Think of Others

Mining Cashflow modeling
In my role as a mining consultant I am often required to review spreadsheet cost models or cashflow models built by others.  Some of these spreadsheets can be monsters, incorporating multiple worksheets, cross-linking between worksheet cells, and having hard wired numbers inside cell formulas.
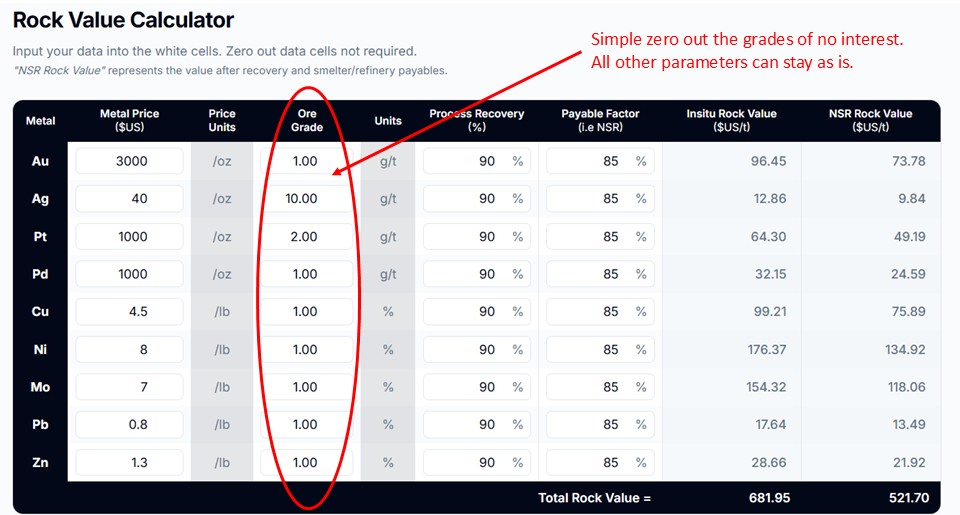
Some of the models I have reviewed will build the entire operating cost (mining, processing, G&A) in one grand file.  They will build in the capital cost too and finally provide the economic model… all in one spreadsheet!
This makes the model very complex to audit and it becomes difficult to follow the logic.  Sometimes gut feel says there are formula or linkage errors in there somewhere but you just can’t find them.  In these types of models my focus is on trying to figure out the formula logic than actually looking at the validity of the inputs and output.
It seems that only the model developer can really work with these spreadsheets and the rest of us can just hope that they have created everything correctly.

Don’t be too clever

Over the years, I have learned that there is an art to creating a clear, concise, and auditable cashflow model (or cost model). Once in awhile you come across one that is well crafted and isn’t an example of someone trying to show how clever they are.
In building the spreadsheet models I have learned to not do too much within the same model, especially if different people are involved in its foundation.  My other suggestions are:
  • Color coded input cells differently than formula cells.
  • Carry over values rather than linking to other worksheets.
  • Highlight cells that are carried over from other worksheets.
  • Never hardwire numbers into a formula.
  • Use named cells for key fixed inputs (like exchange rate, fuel price, etc.)
  • Use conditional formatting when possible to help identify errors.
  • Put your “Totals” column along the left side of the worksheet so you can add columns if needed.
I won’t go into detail on good spreadsheet practices, but you can check out the instructional presentations prepared by Peter Card at Economic Evaluations (http://economicevaluation.com.au).
He has some excellent practical recommendations that all financial modellers should consider.  It doesn’t take long to review his online courses and it’s worth your time to do it.  His recommendations can generally apply to any Excel modelling exercise, whether its costing, scheduling, or economic analysis.

Try to help by building in clarity.

The bottom line is that you must build your spreadsheet models compatible with the way you think.  However not everyone thinks the same way so try to keep all aspects easily identifiable and traceable.  Be consistent in the model format from worksheet to worksheet. Be consistent in methodologies on all worksheets and with all your models.   Your client, colleagues, and reviewers will thank you.
Another aspect of due diligences that can be taxing is figuring out the structure of a data room.   Simply throwing all of your files into an unstructured data room helps no one.   I have written another blog about this annoyance at “Mining Due Diligence Data Rooms – Help!


Note: If you would like to get notified when new blogs are posted, then sign up on the KJK mailing list on the website.  Otherwise I post notices on LinkedIn, so follow me at: https://www.linkedin.com/in/kenkuchling/.
Share