Articles tagged with: Feasibility Study

What Does Ai Think of Toll Milling

I recently noticed a few new mining studies that relied on toll milling as their base case operation. This made me wonder if this is a trend and if there are more examples of where this is happening.
If only there was a way to find out.
I have been tinkering with Ai (mainly ChatGPT and Gemini) to see what it can do, but I never really had a “project” for it to work on.
So I thought, lets see what Ai can tell us about toll milling. This would be an opportunity to test out Claude (AI assistant built by Anthropic) to see what it will deliver. I could ask it a few questions about the concept of toll milling to find out what it would say.
The following blog is the unedited responses that were given to my user prompts. The results, albeit lengthy, are interesting and informative. Let’s dive in.
By the way, this is the first blog post ever where I have applied Ai.

CLAUDE Ai CONVERSATION

USER PROMPT: Can you prepare a list of recent mining studies that used toll milling as the base case.

RESPONSE: Here is a summary of recent mining studies (primarily PEAs and PFS-level studies) that used toll milling as the base case or a key component, based on publicly available information from 2024-2026:
1. RPX GOLD – WAWA GOLD PROJECT (ONTARIO, CANADA) PEA – February 2026
The base case is built entirely around toll milling, with crushed ROM ore trucked to an off-site facility within 150 km for processing into gold dore. No on-site mill or tailings facility is planned, significantly reducing capital requirements. The project sits in the Michipicoten Greenstone Belt near Wesdome, Alamos, and Hemlo operations, all of which offer potential excess capacity.
2. AMEX EXPLORATION – PERRON GOLD PROJECT (QUEBEC, CANADA) Updated PEA – September 2025
Features a two-stage development strategy: a 4-year, 1,000 tpd contract mining and toll-milling operation in Phase 1, followed by construction of an on-site processing plant in Phase 2. The Abitibi region’s numerous operating mills make this approach practical. Initial capex is C$146M, partially offset by C$68.6M in pre-production revenues during the toll-milling phase.
3. CHALLENGER GOLD – HUALILAN PROJECT (ARGENTINA) PFS – 2024/2025
The PFS is structured around toll milling as the path to near-term production, with the study outlining forecast EBITDA of approximately A$221M over a 3-year tolling period at current metal prices. Challenger also executed a binding term sheet with Dolphin Real Assets/Elsztain Group to facilitate processing through a tolling agreement, with the arrangement expected to fund mining, transportation, and processing costs until initial gold revenue is received.
4. SCOTTIE RESOURCES – SCOTTIE GOLD MINE PROJECT (BRITISH COLUMBIA, CANADA) PEA – October 2025
The primary base case is a Direct-Ship Ore (DSO) scenario, but the study prominently presents toll milling at the nearby Premier mill as a significant upside scenario. Under the toll-milling arrangement, the after-tax NPV(5%) rises from C$215.8M to C$380.1M at US$2,600/oz gold – a meaningful enhancement. No formal toll-milling agreement was in place at the time of the study.
5. MAGNA MINING – CREAN HILL PROJECT (ONTARIO, CANADA) PEA – 2024
The PEA incorporates a definitive off-take agreement with Vale Base Metals to process Contact mineralization through Vale’s Clarabelle Mill in Sudbury. This is a firm, contracted toll-milling arrangement rather than a conceptual one, giving the study’s economics a higher degree of confidence in processing costs.
6. AURIC MINING – JEFFREYS FIND GOLD MINE (WESTERN AUSTRALIA) Operational toll-milling program – 2024
While not a formal feasibility study, Auric and joint venture partner BML Ventures executed a contract to toll mill a minimum of 300,000 tonnes of ore through the Greenfields Mill in Coolgardie during 2024. The first stage produced ~9,741 oz of gold at 1.86 g/t, demonstrating the model’s viability for small, high-grade open pit operations lacking on-site processing infrastructure.
GENERAL OBSERVATIONS:
Toll milling as a base case is most common in:
– Early-stage PEAs for junior developers in established mining districts (Abitibi, Michipicoten, Sudbury) where nearby mill capacity exists.
– High-grade, lower-tonnage projects where the capital cost of a dedicated mill is hard to justify at the outset.
– Projects pursuing a phased development path to generate near-term cash flow before committing to full plant construction.


USER PROMPT: What are the risks of toll milling plan.

RESPONSE: Toll milling carries several meaningful risks that study authors and investors should consider carefully.
OPERATIONAL & LOGISTICS RISKS
The most fundamental risk is mill availability. A toll miller may prioritize its own ore or other clients during peak periods, leaving your project without processing capacity exactly when you need it. Scheduling conflicts can delay production and erode project economics significantly. Transportation of ore or concentrate over long distances also introduces costs that are sensitive to fuel prices, road conditions, and seasonal access – particularly in remote northern jurisdictions.
COMMERCIAL & CONTRACTUAL RISKS
Toll milling agreements are typically not long-term ironclad contracts, and terms can be renegotiated or terminated. The toll miller holds significant leverage, especially if there are few alternative processors nearby. Processing rates, payable metal terms, and penalty clauses for deleterious elements can all shift unfavorably over time. If no binding agreement exists at the study stage – as was the case with Scottie Resources – the entire economic base case rests on an assumption rather than a firm commitment.
METALLURGICAL RISKS
The toll miller’s circuit is optimized for their own ore, not yours. Differences in mineralogy, grind size requirements, or the presence of penalty elements like arsenic, bismuth, or mercury can result in lower recoveries than modeled, higher processing charges, or outright refusal to accept the ore. Blending your material with the host mill’s feed can also complicate settlement and metal accounting.
FINANCIAL & ROYALTY RISKS
Without ownership of the processing facility, you have limited control over costs. Any increase in the toll miller’s operating costs – energy, reagents, labor – can be passed through to you. Additionally, some royalty structures are calculated on net smelter returns, meaning toll milling charges directly reduce the royalty base and affect third-party obligations.
REGULATORY & PERMITTING RISKS
Transportation of ore across jurisdictions may require additional permits, environmental assessments, or spill containment plans. If the toll mill’s own permits are challenged or its tailings facility reaches capacity, your project could be indirectly affected by regulatory actions aimed at a third party.
STRATEGIC RISKS
Relying on toll milling can delay the development of on-site infrastructure and institutional processing knowledge, which matters if the long-term plan is to build a dedicated mill. It can also make the project harder to finance or sell, since acquirers typically prefer integrated operations with controlled processing costs. Finally, if the toll miller is acquired, restructured, or shuts down, continuity of the arrangement is immediately in question.
In short, toll milling is an elegant solution for reducing upfront capital, but it trades capex risk for a different set of operational, commercial, and strategic risks that need to be carefully managed and clearly disclosed in any technical study.

USER PROMPT: What responsibility does the Qualified Person have in signing off on a study with toll milling.

RESPONSE: The Qualified Person (QP) signing off on a technical study that uses toll milling as the base case carries significant professional and regulatory responsibility, particularly under NI 43-101 in Canada or JORC in Australia.
CORE RESPONSIBILITY UNDER REGULATION
Under NI 43-101, the QP must take responsibility for the technical report in its entirety, or for clearly delineated sections where multiple QPs are involved. The QP must have sufficient relevant experience not just in geology or engineering broadly, but specifically in the type of deposit and the technical aspects being certified – which in a toll milling scenario includes process engineering, metallurgy, and mine economics. A geologist signing off on processing assumptions they are not qualified to assess would be in breach of their obligations.
REASONABLENESS OF ASSUMPTIONS
The QP is required to certify that the study’s assumptions are reasonable and reflect industry best practice. For toll milling specifically, this means the QP must be satisfied that the processing costs used in the economic model are realistic and supportable. If the toll milling rate is based on a verbal understanding or a letter of intent rather than a binding agreement, the QP must disclose this clearly and assess whether the assumed rate is achievable in the current market. Using a stale or unsupported toll rate without disclosure would represent a failure of duty.
DISCLOSURE OF RISKS
The QP has an affirmative obligation to disclose material risks that could affect the project’s viability. A rigorous technical report should explicitly identify the risks associated with toll milling – mill availability, contract uncertainty, metallurgical compatibility, transportation costs – rather than burying them in boilerplate language. Superficial or generic risk disclosure that does not reflect the specific circumstances of the toll milling arrangement would fall short of professional standards.
METALLURGICAL COMPETENCE
If the study relies on recoveries and processing costs derived from testwork conducted on the toll miller’s circuit, the QP must evaluate whether that testwork is adequate, recent, and representative of the ore to be processed. If no testwork has been done on the specific mill to be used, the QP must justify why analogous data is sufficient, and must disclose the uncertainty this introduces. Blindly accepting a recovery assumption without interrogating its basis is a serious professional risk.
INDEPENDENCE AND CONFLICTS OF INTEREST
NI 43-101 requires the QP to be independent in certain circumstances, and to disclose any relationships with the issuer. If the toll miller is a related party or has a financial interest in the project, the QP must consider whether this creates a conflict that needs to be disclosed or whether it affects the reliability of commercial terms assumed in the study.
SITE VISIT REQUIREMENTS
The QP is generally required to have conducted a site visit. In a toll milling scenario, a thorough QP would arguably need to be familiar not just with the mine site but with the processing facility to be used – its condition, spare capacity, metallurgical compatibility, and operational track record. Signing off on processing assumptions for a facility that has never been visited or independently assessed is a professional vulnerability.
PRACTICAL AND PROFESSIONAL CONSEQUENCES
If a study proves materially misleading due to unsupported toll milling assumptions, the QP faces regulatory action from securities regulators, professional discipline from their engineering or geoscience association, civil liability to investors, and reputational damage. Canadian securities regulators have historically taken a dim view of QPs who rubber-stamp economic assumptions without genuine independent verification.
In summary, the QP’s responsibility in a toll milling study is not merely to sign a form – it is to genuinely interrogate the commercial, metallurgical, and logistical assumptions underpinning the arrangement, ensure they are adequately disclosed, and take personal professional accountability for their reasonableness. A QP who treats toll milling as a convenient shortcut to a positive economic outcome without doing this work is exposing themselves to considerable risk.
I asked Claude to create a QP checklist for factors that should be reviewed for a toll milling study.  You can download that file at this link  DOWNLOAD FILE.

CONCLUSION

The results given by Claude are quite thorough and insightful. It’s hard to argue with its observations and conclusions. This research took all of 30 seconds, so I can see it is no longer difficult to become a blog writer. Writing isn’t the challenge; finding interesting topics is.
One toll milling project that Claude did not list was the Galway Metals Estrades Project PEA published February 18, 2026. Perhaps that study was too recent to be familiar with it.
While Claude is not a mining specific Ai platform, there are some that are under development with a mining research focus. Some of these include MineGPT , SureOre.ai, ProspectorAi , and there are probably even more out there.
This area will continue to evolve, and may help mitigate the technical personnel shortage being experienced.
You can sign up for the KJK mailing list to get notified when new blogs are posted. Follow me on Twitter at @KJKLtd for updates and other mining posts. The entire blog post library can be found at https://kuchling.com/library/
Share

Filtered Tailings Testing Checklist

I have always been a big proponent of filtered (or dry stack) tailings over conventional tailings disposal. Several years ago I had written a blog (Fluid Tailings – Time to Kick The Habit?)  that this is the tailings disposal approach the mining industry should be moving toward.
Recently I have been seeing more mining studies proposing to use the dry stack approach. In some cases, they no longer even do the typical tailings trade-off study that look at different options. The decision is made upfront that dry stack is the preferred route due to its environmental acceptability and positive perceptions.
Recently I came across a nice document prepared by BHP and Rio Tinto titled “Filtered Stacked Tailings – A Guide for Study Managers (March 2024)”. I will refer to this document as “The Guide”. You should definitely get a copy of this Guide if your project is considering a dry stack operation. An information link is included at the end of this post.

A Guide for Study Managers

The Guide covers several topics, including tailings characterization; site closure concepts; filtered tailings stack design; material transport, stacking systems; and tailings dewatering methods. The Guide covers all the basics very well. The one area that jumped out at me is the tailings characterization and testing aspect.
Many assume that dry stack is simply filter, haul, dump, then walkaway. Its all very easy! However, in reality, the entire dry stack approach is complex.
One needs to be able to consistently dewater tailings from different ore types, then transport it under different climatic conditions, and then place and compact the tailings efficiently.
One also needs to be able to deal with plant upsets, when the filtered tailings don’t meet the optimal product specifications. So its not really that simple.
One of the chapters in the Guide details the different test work that should be done to understand the dry stack approach.  The list of tests is a lot longer than I had envisioned.  I previously knew some of the types of lab testing required, however the Guide outlines a very comprehensive list.
The Guide also categorizes the tests according to study stage, be it concept study, order of magnitude study, or Pre-Feasibility level. Interestingly, the concept study can rely mainly on published information. However, the more advanced mining studies require the lab testing of actual tailings material.

Testing Checklist

To help organize the complexity of testing, I have listed their suggested tests as to whether the test is related to material characterization, process characterization, or filtered product characterization. Each aspect serves a different purpose in understanding the workings of the filtered tailings approach. The engineer will decide at which study stage they wish to do each of the tests, or which of the them they actually need to do.
To keep the blog post brief, I am not describing the details for each test. Most geotechnical or process engineers will already be familiar with them, or anyone can search the web to learn more.

MATERIAL CHARACTERIZATION TESTS

  • Chemical composition Testing: using atomic absorption or spectroscopy, identify the elements within the tailings stream to highlight contaminants and potential flocculation issues.
  • Conductivity Test: increase knowledge of the tailings stream.
  • Mineralogy Testing: identify mineral types and clay minerals (if any) that could impact on performance.
  • Particle Shape Analysis: are there fibrous minerals present, as well as settling and rheology effects.
  • Particle Size Distribution: are the tailings coarse, or mainly fine silt and clay sized particles that can impact on filtering and product performance.
  • pH Test: determine the acidity of the tailings steam, can relate to flocculant selection.
  • Tailings Slurry Density Test: assess the pumpability and amount of thickening and filtering that will be required.
  • Tailings Solid Mass Concentration and Moisture content: required for process mass balances.
  • Specific Gravity Testing: assess the SG of the tailing particles, i.e. light or heavy minerals.
  • Total Dissolved Solids Test: assess the fluid composition, are minerals dissolvable.
  • Zero Free Water Test: relates to the solids concentration at which the sample is fully saturated and may relate to transportability.

PROCESS CHARACTERIZATION TESTS

  • Total Suspended Solids: assess the quality of the return water from thickening or filtration.
  • Drained and Undrained Settling Test: to assess the thickening aspects and stack performance.
  • Setting Cylinder Tests: used to assess thickener settling performance.
  • Raked Setting Cylinder Tests: used to assess thickener settling performance.
  • Dynamic Continuous Settling Tests: used to assess thickening under continuous feed situation.
  • Minimum Moisture Content: assess the minimum moisture content achievable in filtration.
  • Vacuum/Pressure Filtration Test: often done by vendors, assess the filtering performance.
  • Compression Rheology: design consolidation / permeability data for filtering and disposal design.
  • Shear Rheology: provide information for pump and pipeline design.
  • Shear Yield Stress: provide processing insights for slurry dispersion and flocculation.

FILTERED PRODUCT CHARACTERIZATION TESTS

  • Leaching Tests (long term): assess whether the tailings stack will continue to leach metals and contaminants over the long term.
  • Leaching Tests (short term): assess whether the tailings stack will rapidly leach metals and contaminants.
  • Acid Base Accounting Tests: will the stack be an ARD concern.
  • Net Acid Generation: relates to ARD and neutralizing potential.
  • Air Drying Tests: determine the rate of natural air drying and dry density.
  • Atterberg Limits Testing: determine the plastic limit, liquid limit with respect to moisture content and stackability.
  • Consolidation Tests (one-dimensional): to assess the consolidation and settlement of the stack over time.
  • Proctor Density Tests: assess the optimal compacted density and moisture content vs the moisture content delivered by filtration.
  • Critical Void Ratio Tests: assess compaction, consolidation, and liquefaction potential.
  • Shear Testing: determine the geotechnical strength of the filtered product for stack height design.
  • Permeability Testing: assess the internal drainage characteristics of the filtered product.
  • Soil-water characteristics Tests: assess the unsaturated behavior of the filtered product.
  • Flow Moisture Point Tests: assess how well the material can be transported and placed.
  • Conveyance Testing: assess how well the material can be conveyed (troughing, steepness).
  • Minimum Angle for Discharge: used in the design of hoppers and chutes.
  • Angle of Repose Tests: used in hopper design and dry stack design. Ground Bearing Pressure: used to assess the trafficability of the deposit.

Conclusion

A dry stack operation might be just as complex as conventional tailings disposal, although that might not be the perception. Certainly, the processing side of filtered tailings is more complex than conventional tailings. The transportation design may also be more complex, as is the tailings placement methodology. The main complexity missing from the dry stack is the need for a large sludge retaining dam, albeit that is a huge and important difference.
Some might view the suggested testing checklist as overkill and decide that not all test work is necessary. That is most likely true for some situations, especially for small mines not dealing with large quantities of tailings. However for a project with a high capital investment, one doesn’t want to see the entire mill off-line because the tailings disposal system isn’t functioning.
Major miners, such as BHP and Rio Tinto, typically spare no expense on material testing for metallurgical or geotechnical purposes. They have the funds available to test and engineer to a high level to adequately de-risk the project to meet their investment thresholds.
Junior miners often don’t have the time or funds to spend on such comprehensive testing programs. “Good enough” is often good enough.
One reason why junior miners sign 5-year JV deals with the Major is the amount of technical work required to properly evaluate a project.
The Major understands the amount of time needed for sample collection, testing, analysis of results, and follow up with more testing. It takes a fair bit of time to reach a comfort level for moving forward. Even then, there are no guarantees of success.
Each tailings disposal project is unique in size, location, type of mineralization, site layout, and throughput rate, so each company must decide what level of testing is “good enough” to address their risk tolerance.
For those that would like to get a copy of the the Guide, you can find more information at this LinkedIn link.   I thank BHP and Rio Tinto for putting their heads (and wallets) together to prepare (and share) this document.


Note: You can sign up for the KJK mailing list to get notified when new blogs are posted. Follow me on Twitter at @KJKLtd for updates and other mining posts. The entire blog post library can be found at https://kuchling.com/library/
Share

Mine Builders vs Mine Vendors

Normally when Major or Intermediate miners advance their projects through the study stages, they usually have the intent to build the mine at some time.  Sometimes they may decide to sell the project if it no longer fits in their corporate vision or if they desperately need some cash.   However, selling the project was likely not their initial intent.
On the other hand, Junior miners tend to follow one of two paths.  They are either on (a) the Mine Builder path, or (b) the Mine Vendor path (i.e. sell the project).  In this article, I will present some examples of companies on each path.   There will also be some discussion on whether the engineers undertaking the early stage studies (e.g., PEA’s) should be considering the path being followed.

The Mine Builder Path

The Mine Builder generally follows a systematic approach, as sketched out in the image below.  The project advances from drilling to Mineral Resource Estimate (MRE), scoping study (PEA), then through the Pre-Feasibility Study (PFS) and/or Feasibility Study (FS) stages.  Environmental permitting is normally proceeding in conjunction with the engineering. Once the FS is complete, the next hurdles for the Mine Builder are financing and construction.   The path is fairly orderly.
Mining Project Builder Path
The amount of the exploration drilling is only needed to define an economic resource to the Measured and Indicated classifications.   There is no requirement to delineate the mineral resource on the entire property since there will be time to do that during production.   Demonstrating an economic resource, with some upside potential, is often sufficient for the Mine Builder.
Three examples of companies on the Builder path are shown below; Orla Camino Rojo gold project (in operation), SilverCrest Las Chispas gold project (in operation), and Nexgen Rook uranium project (financing stage).   Although the duration of each timeline is different due to different project complexities, the development paths are consistent.  Most junior miners would not consider themselves on the Builder path.

The Mine Vendor Path

Mine Vendor type organizations have the primary goal of selling their project.  These companies may consist of management teams that don’t have the desire, comfort, or capability to put a mine into production. For example, this is often the case with companies founded by exploration geologists, whereby their plan is to explore, grow, and sell all (or part) of the project.   In other cases the Junior miner realizes their project is large with a high capital cost.  That capital cost is beyond the financial capability of the company.  Hence a deep-pocket partner is required or an outright sale is preferred.
Mining Project Vendor Path
The Mine Vendors tend to follow a different development path than the Mine Builders. They don’t have the same long term objectives.  Vendors want out at some point.
The Vendor path can be more irregular, with multiple studies undertaken at different levels of detail, sometimes stepping back to lower level of studies as more information is acquired.  Their object is to make the project look good to potential buyers, and look better than their junior miner competitors also for sale.  Often this ongoing project improvement process is termed “de-risking”.
Not only must the Vendors demonstrate an economic resource, they must demonstrate a highly valuable resource to maximize the acquisition price for the shareholders.  They will try to do this through multiple drill campaigns followed by multiple studies, each one looking better than the prior one.
Sometimes you will see a management team indicate that, if the project isn’t sold, they are going to put it into production themselves.  This may be true in some cases, or simply part of the negotiating game to try to maximize the acquisition price.
Two quick examples of companies on the Vendor path are shown below: Western Copper Casino project and Seabridge KSM project.  The durations of these development timelines are extensive and expensive, while waiting for an interested buyer.   During these periods, the companies may continue to spend money de-risk the project further.  The hope is that the company can eventually make the project attractive or that changing market conditions will make it attractive for them.   Unfortunately, there is always the possibility that no buyer will ever come along.

Engineer’s Perspective

One question is whether the independent geologists and engineers working on the advanced studies should be aware of the path the company is following. Is the company a Builder or a Vendor?
Some may feel that the technical work should be independent of the path being followed.  Based on my experience as both an owner’s representative and independent study QP, I have a somewhat different opinion.  The technical work should be tailored to the intended path.

The Engineer on the Mine Builder Path: 

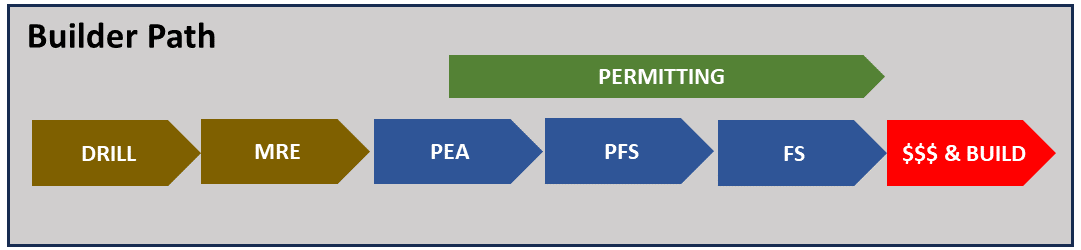
If an engineer understands that a Mine Builder’s project will move from PEA to PFS to FS in rapid succession, then there is more incentive to ensure each study is somewhat integrated.
For example, a PEA will use Inferred resources in the economics.  However, if the project will advance to the PFS stage, where Inferred cannot be used, then it is important for the PEA to understand the role that Inferred plays in the economics.    How much drilling will be needed to upgrade Inferred resource to Indicated for the PFS, if needed at all?
Typically, capital costs tend to increase as advancing studies get more accurate due to greater levels of engineering.   A Builder wants to avoid large cost increases when moving from PEA to PFS to FS.  Therefore, when costing at the PEA stage, one may wish to increase contingency or use conservative design assumptions.  After all, one is not trying to sell or promote the project internally, but rather move it towards production.
There is no value to the Mine Builder by fooling themselves with low-balled cost estimates.  (Although some may argue there is still a desire to low ball costs to get management to approve the project).    Conversely Mine Vendors do have some incentive to low ball the costs.
Perhaps some of the recent project capital cost over-runs we have seen is that the Vendor mentality was used at the PEA stage to optimistically set the capital cost baseline.  Subsequent studies were then forced to conform to that initial baseline. Ultimately construction will be the arbiter on the true project cost.  Hence there is no real value in underestimating costs, ultimately making management appear incompetent if costs do over-run.
The Mine Builder will also be advancing environmental permitting simultaneously with their advanced studies.  Hence at the early stage (PEA) it is important to properly define the site layout, processing method, production rate, facility locations, etc. since they all feed into the permitting documents.
Changing significant design details in the future will set back the permitting and construction timelines.  Hence, for the Mine Builder, the engineers should focus on getting the design criteria mostly correct at the PEA stage.  For the Mine Vendor, this is not as important since multiple studies are being planned for in the future anyway.

The Engineer on the Mine Vendor Path: 

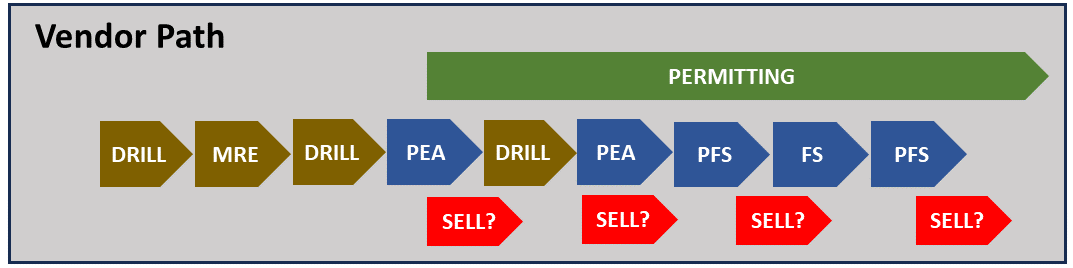
The objective of the Mine Vendor is to make the project attractive to potential buyers.  There is less urgency in fast tracking detailed engineering and permitting.
It is not uncommon to see multiple drilling programs, followed my multiple studies of scenarios with different size, production rate, and layout.   The degree of engineering conservativeness in design and costing is less critical since future studies may be on substantially different sized projects.
The role that the Inferred resource plays in the economics is also less important at this time, since a lot more drilling may be coming. The Vendor’s objective tends to be on maximizing resource size not necessarily optimizing resource classification.
While the Mine Vendor may also be advancing environmental permitting as another way to de-risk the project, the project design may still be in flux as the resource size changes.  Major modifications to the plan may cause permitting to stop and re-start, leading to an extended project timeline and wasted money.
There is also risk in starting the permitting with a project definition that isn’t of economic interest to future buyers.  Sometimes the Vendor may be making regulatory commitments that constrain the operating flexibility of future mine operators. Its easy to commit to things when you aren’t the one having to live up to them.
The Mine Vendor will also de-risk the project by moving from PEA to PFS and even to FS.   The caution with completing a FS is that it is a costly study and essentially brings one to the end of the study line.  What does the company do next if there is still no buyer?
Feasibility studies also have a shelf life, with the cost estimates and economics becoming inaccurate after a few years.  Some companies may re-examine the project, re-frame it, and jump back to the PEA or PFS stages.  There can be an on-going study loop, requiring continued funding with no guarantee of a sale in sight.  Often feasibility studies have the dual role of trying to boost the share price and market cap, as well as frame the project for potential buyers.

Conclusion

As an engineer, it is helpful to understand the objectives of the project owner and then tailor the technical studies to meet those objectives.  This does not mean low balling costs to make the study a promotional tool.  It means focusing on what is important.  It means recognizing the path, and what doesn’t need to be engineered in detail at this time.  This may save the client time, money, and improve credibility in the long run.
In many cases, the precise size of the deposit is less important than understanding the site, access, water supply, local community issues, the environmentally acceptable location for dumps and tailings, etc..   It can be more important to focus on these issues rather than having a detailed mine plan with multiple pit phases that immediately becomes obsolete in a few months after the next drilling campaign.
Potential buyers will have their own technical team that will develop their own opinions on what the project should be and what it should cost.   Just because a Mine Vendor has a feasibility study in hand, doesn’t mean a potential buyer will believe it.
This post is just a brief discussion of mining project timelines.   For those interested, there a few additional project timelines for curiosity purposes.   Each path is unique because no two mining projects are the same.  You can find these examples at this link “Mining Project Timelines”.
Let me know about other interesting projects that have interesting paths to learn from.  I can add them to the list.
Note: You can sign up for the KJK mailing list to get notified when new blogs are posted. Follow me on Twitter at @KJKLtd for updates and other mining posts. The entire blog post library can be found at https://kuchling.com/library/


Share

Don’t Cut Corners, Cut Cross-Sections Instead

Exploration cross-section
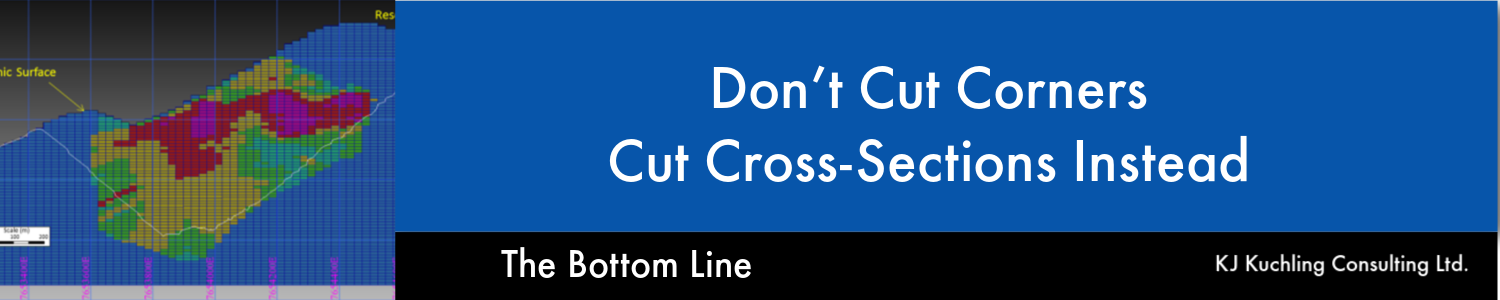
This article is about the benefit of preparing (cutting) more geological cross-sections and the value they bring.
Geological sections are one of the easiest ways to explain the character of an orebody. They have an inherent simplicity yet provide more information than any other mining related graphic.
Some sections can be simple cartoon-like images while others can be technically complicated, presenting detailed geological data.
Cartoon-stylized sections are typically used to describe the general nature of the orebody. The detailed sections can present technical data such as drill hole traces, color coded assays intervals, ore block grades, ore zone interpretations, mineral classifications, etc.
Sections provide a level of clarity to everyone, including to those new to the mining industry as well as those with decades of experience.
This article briefly describes what story I (as an engineer) am looking for in sections. Geologists may have a different view on what they conclude when reviewing geological sections.
I will describe the three types of geological sections that one can cut and what each may be describing. The three types are: (1) longitudinal (long) sections; (2) cross-sections; (3) bench (level) plans. Each plays a different role in helping to understand the orebody and mining environment.
There is also another way to share simple geological images via3D PDF files. I will provide an example later.

Longitudinal (Long) Sections

Geological long section examples
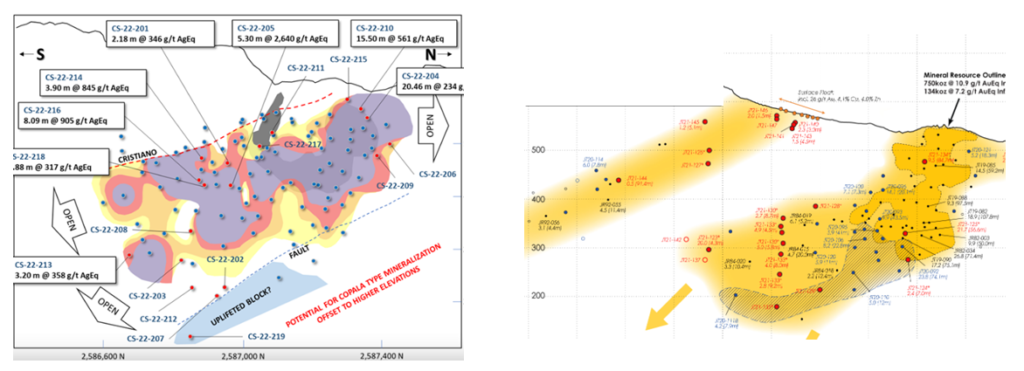
Long sections are aligned along the long axis of the deposit. They can be vertically oriented, although sometimes they may be tilted to follow the dip angle of an ore zone.
Long sections are typically shown for narrow structure style deposits (e.g. gold veins) and are typically less relevant for bulk deposits (e.g. porphyry).
The information garnered from long sections includes:
  • The lateral extent of the mineralized structure, which can be in hundred of metres or even kilometers. This provides a sense for how large the entire system is. Sometimes these sections may show geophysics, drilling to defend the basis for the regional interpretation.
  • Long sections will often highlight the drill hole pierce points to illustrate how well the mineralized zone is drilled off. Is the ore zone defined with a good drill density or are there only widely spaced holes? As well, long sections can show how deep ore zone has been defined by drilling. On some projects, a few widely spaced deep holes, although insufficient for resource estimation purposes, may confirm that the ore zone extends to great depth. This bodes well for potential development in that a long life deposit may exist.
  • Sometimes the long section drill intercept pierce points can be contoured on grade, thickness, or grade-thickness. This information provides a sense for the uniformity (or variability) of the ore zone. It also shows the elevations of the higher grade zones, if the deposit is more likely an open pit mine, an underground mine, or a combination of both.

Cross-Sections

Geological pit section
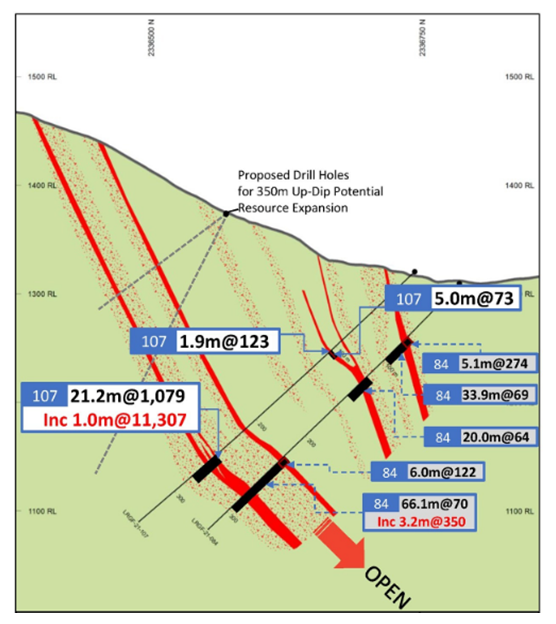
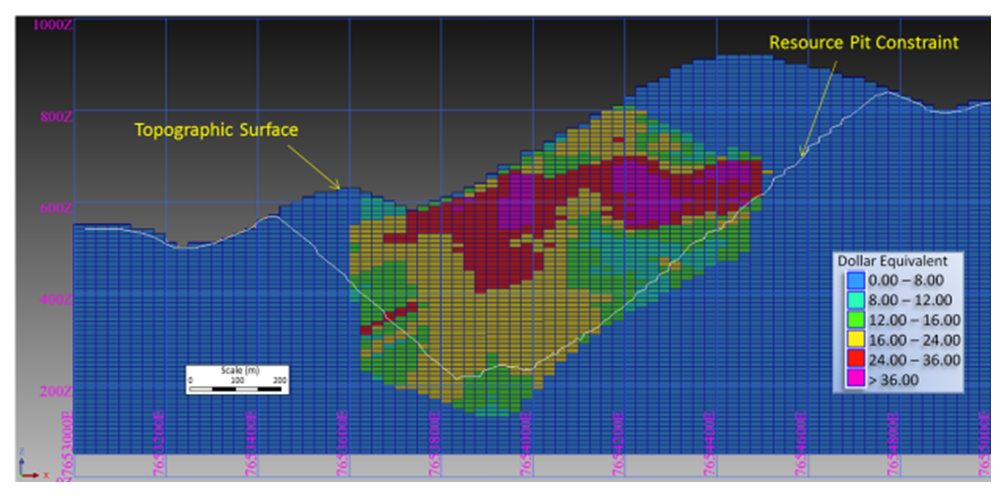
Cross-sections are generally the most popular geological sections seen in presentations. These are vertical slices aligned perpendicular to the strike of the orebody. They can show the ore zone interpretation, drill holes traces, assays, rock types, and/or color-coded resource block grades.
As an engineer, my greatest interest is in seeing the resource blocks, color coded by grade. Sometimes open pit shells may be included on the section to define the potential mining volume. The engineering information garnered from block model cross-sections includes:
  • Where are the higher-grade areas located; at depth or near surface?
  • If a pit shell profile is included, what will the relative strip ratio look like? Are the ore zones relatively narrow compared to the size of the pit?
  • How will the topography impact on the pit shape? In mountainous terrain, will a push-back on pit wall result in the need to climb up a hillside and create a very high pit slope? This can result in high stripping ratios or difficult mining conditions.
  • Does the ore zone extend deeper and if one wants to push the pit a bit deeper, is there a high incremental strip ratio to do this? Does one need to strip a lot of waste to gain a bit more ore?
  • Are the widths of the mineable ore zones narrow or wide, or are there multiple ore zones separated by internal waste zones? This may indicate if lower-cost bulk mining is possible, or if higher cost selective mining is required to minimize waste dilution.
  • How difficult will it be to maintain grade control? For example, narrow veins being mined using a 10 metre bench height and 7 metre blast pattern will have difficulty in defining the ore /waste contacts.
  • Cross-sections that show the ore blocks color coded by classification (Measured, Indicated, Inferred), illustrate where the less reliable (Inferred) resources are located and how much relative tonnage may be in the more certain Measured and Indicated categories.
Geological cross-section example
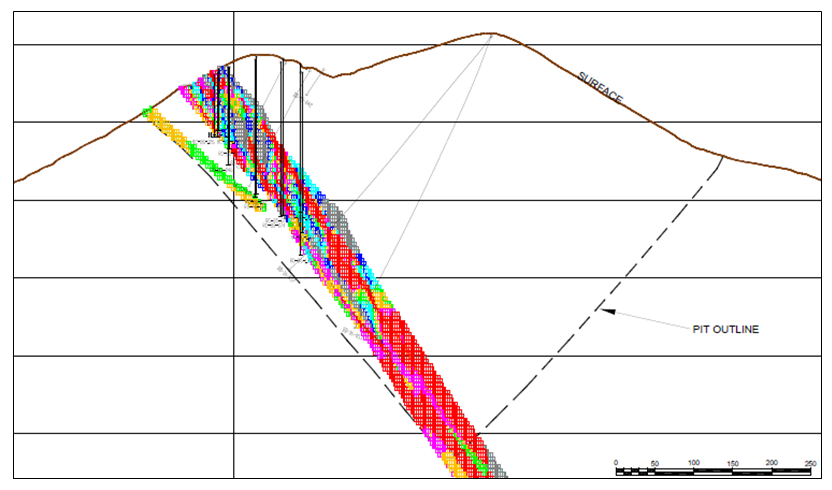
When looking at cross-sections, it is always important to look at multiple cross-sections across the orebody. Too often in reports one may be presented with the widest and juiciest ore zone, as if that was typical for the entire orebody.  It likely is not typical.
Stepping away from that one section to look at others is important. Possibly the character of the ore zones changes and hence its important to cut multiple sections along the orebody.

Bench (Level) Plans

Mining Bench Plans
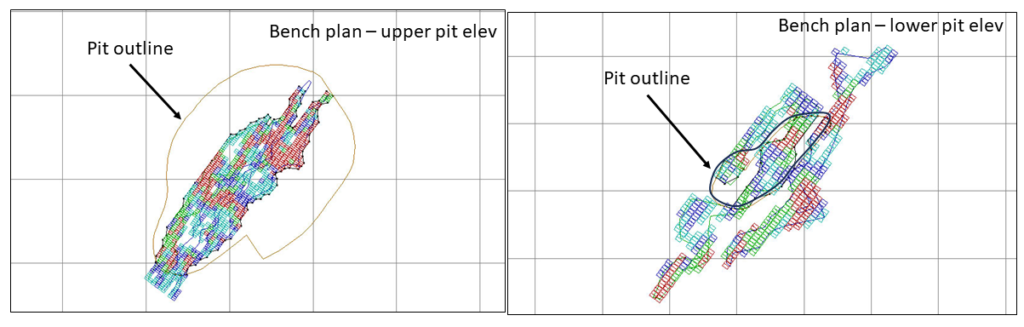
Bench plans (or level plans) are horizontal slices across the ore body at various elevations. In these sections one is looking down on the orebody from above.
Level plans are typically less common to see in presentations, although they are very useful. The level plans may show geological detail, rock types, ore zone interpretations, ore block grades, and underground workings.
The bench plan represents what the open pit mining crews would see as they are working along a bench in the pit. The information garnered from bench plans that include the block model grades includes:
  • Where are the higher-grade areas found on a level? Are these higher grade areas continuous or do they consist of higher grade pockets scattered amongst lower grade blocks?
  • Do the ore zones swell or pinch out on a bench? A vertical cross-section may give a false sense the ore zones are uniform. The bench plan gives an indication on how complicated mining, grade control, and dilution control might be for operators.
  • Do the ore zones on a bench level extend out beyond the pit walls and is there potential to expand the pit to capture that ore?
  • On a given bench what will the strip ratio be? Are the ore zones small compared to the total area of the bench?
As recommended with cross-sections, when looking at bench plans, one should try to look at multiple elevations.  The mineability of the ore zones may change as one moves vertically upwards or downwards through a deposit.

Never mind cross-sections – give me 3D

While geological sections are great, another way to present the orebody is with 3D PDF files to allow users to view the deposit in three-dimensions. Web platforms like VRIFY are great, but I have been told they sometimes can be slow to use.
Mining 3D PDF file3D PDF files can be created by some of the geological software packages. They can export specific data of interest; for example topography, ore zone wireframes, underground workings, and block model information. These 3D files allows anyone to rotate an image, zoom in as needed and turn layers off and on.
You can also create your own simplistic cross-sections through the pdf menus (see image).
A simple example of such a 3D PDF file can be downloaded at this link (3D DPF File Example). It only includes two pit designs and some ore blocks to keep it simple.
The nice thing about these PDF files is that one doesn’t need a standalone viewer program (e.g. Leapfrog viewer) to view them. They are also not huge in size. As far as I know 3D PDF files only work with Adobe Reader, which most everyone already has.  It would be good if companies made such 3D PDF files downloadable along with their corporate PowerPoint presentations.

Conclusion

Exploration cross-section example
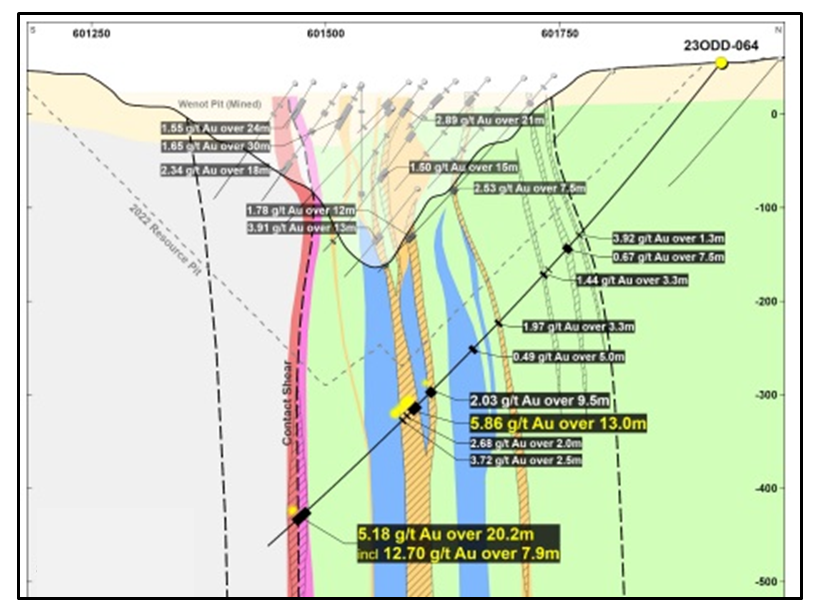
The different types of geological sections all provide useful information. Don’t focus only on cross-sections, and don’t focus only on one typical section.  Create more sections at different orientations to help everyone understand better.
In 2019 I wrote an article describing the lack of geological cross-sections in many 43-101 technical reports. The link to that article is her “43-101 Reports – What Sections Are Missing?
Geological sections are some of the first items I look for in a report. Sometimes they can be hidden away in the appendices at the back of the report. If they are available, take the time to actually study them since they can explain more than you realize.
Note: You can sign up for the KJK mailing list to get notified when new blogs are posted. Follow me on Twitter at @KJKLtd for updates and other mining posts. The entire blog post library can be found at https://kuchling.com/library/
Share

Grade-Tonnage Curves – Worthy of a Good Look

Most of us have seen the typical “grade-tonnage” table or graph, showing ore tonnes and grade at varying cutoff grades. It is usually part of every 43-101 technical report in Section 14.  We may glance at it quickly and then move on to more exciting chapters. Section 14 (Mineral Resources) can be a very complex chapter to read with statistics, geostatistics, and mathematical formulae.  However the grade-tonnage curve aspect isn’t complicated at all.
The next time you see the grade-tonnage relationship, I suggest taking a few seconds to study it a bit further.   There might be some interesting things in there.

Typical Grade-Tonnage Information

Typically, one will see grade-tonnage data in 43-101 Technical Reports towards the back of Section 14 "Mineral Resources".  The information is normally presented in either of two ways; (i) a grade-tonnage table or (ii) a grade tonnage graph.  Examples of each are shown below.  The grade tonnage graph typically has the cutoff grade along the bottom x-axis and the two separate y-axes  representing the ore tonnes above cutoff and the average ore grade above cutoff.
typical grade tonnage table
typical grade tonnage curve
Rarely do you see both the table and curve in the report, although ideally one would want to see both.  Given the option, I would prefer to see the graph more than the table of numbers.  The trend of the grade-tonnage information is just as important as the values, maybe even a bit more important.  Unfortunately, a data table by itself doesn’t illustrate trends very well.

Useful Grade-Tonnage Curve Information

mining grade tonnage curve
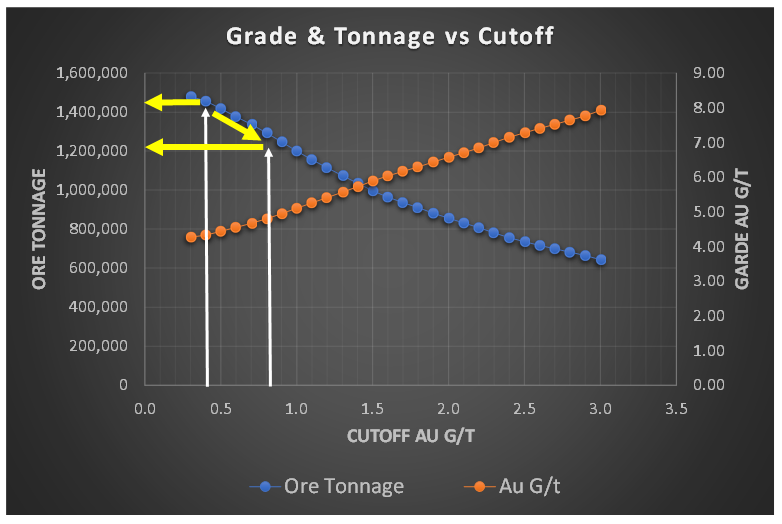
When I am undertaking a due diligence review or working on a study, very early on I like to have a look at the grade-tonnage information.  This could be for the entire deposit resource, within a resource constraining shell, or in the pit design.
The grade-tonnage information gives an understanding of how future economics or technical issues may impact on the mineable tonnage.
An example of a typical grade-tonnage curve is shown here.
The cutoff grade along the x-axis will be impacted by changes in metal price or operating cost. The cutoff grade will increase if metal prices decrease or if operating costs increase.
The question is how sensitive is the mineable tonnage to these economic factors. The slope of the tonnage and grade curves will help answer this question.
In the example shown, the tonnage curve (blue dots) is fairly linear, meaning the ore tonnage steadily decreases with increasing cut-off grade.  That is expected and is reasonable.
mining grade-tonnage curve
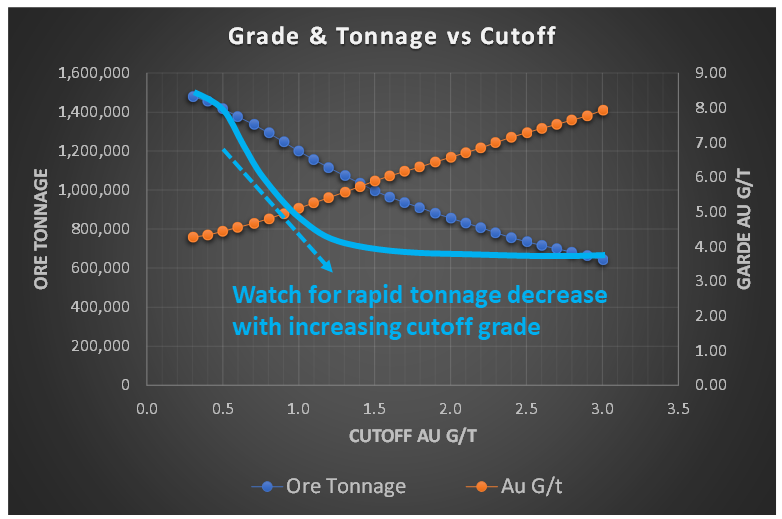
However, if the tonnage curve profile resembled the light blue line in this image, with a concave shape, the ore tonnage is decreasing rapidly with increasing cutoff grade.   This is generally not a favorable situation.
It indicates that a significant portion of the tonnage has a grade close to the cutoff grade.  If that’s the situation, the calculation of the cutoff and the inputs used to generate it are important and worthy of scrutiny.  Are they reasonable?  Over the long term, is the cutoff grade more likely to increase or decrease?
The same logic can be used with the ore grade curve in the graph.  As  shown in this example, the ore grade increases steadily as the cutoff is raised.  This is because lower grade ore is being shifted from ore to waste, and hence the remaining ore has better quality.  If the cutoff is raised from 0.4 g/t to 0.5 g/t, then some material with a grade of about 0.45 g/t is moved from ore to waste.
I also like to compare the ratio of the average grade to the cutoff grade.  Its nice to see a ratio of 4:1 to 5:1 to ensure the overall average grade isn’t close to the cutoff.  In this example, the cutoff grade is 0.5 g/t and the average grade is 4.5 g/t, a ratio of 9:1.
The tonnage curve and grade curve provide information on the nature of the mineral resource. Study them both.

Reporting Waste Within a Shell

One complaint I have about reporting mineral resources inside a resource constraining shell is the lack of strip ratio information. This applies whether disclosing a single mineral resource estimate or variable grade-tonnage data.
In my view, the strip ratio is even more important to be aware of when looking at grade tonnage data.
The strip ratio within a shell will climb as an increasing cutoff grade results in a decreasing ore tonnage.  Sometimes the strip ratio will increase exponentially. The corresponding amount of waste remaining in that pit shell increases, hence the ratio of the two (i.e. strip ratio) can escalate rapidly.
mining strip ratio curve
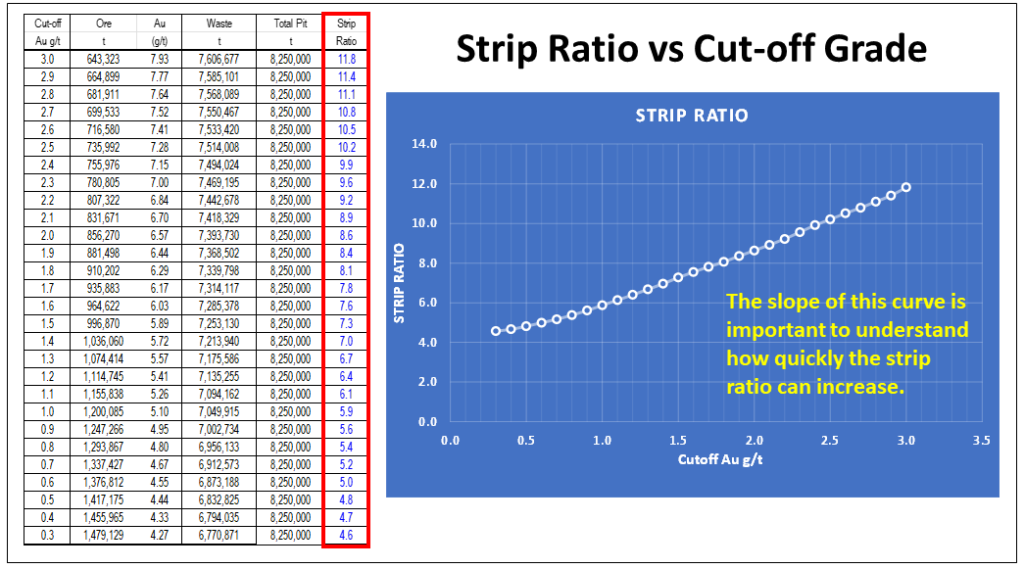
Regarding mineral resources, one should be required to disclose the waste tonnage and strip ratio when reporting resources inside a constraining shell. The constraining shell and cutoff grade are both based on defined economic factors such as unit mining costs, processing cost, process recoveries, and metal prices.  With respect to the mining cost component, the strip ratio is a key aspect of the total mining cost, yet it normally isn’t disclosed.
Its common to see mention that the mining cost is (say) $2.50/t, but if the strip ratio is 10:1, that equates to an effective mining cost of $27.50 per tonne of ore.   That’s an important cost to know, especially if one is pushing a pit shell deep to maximum the mineral resource tonnage.
Each mineral deposit resource model can behave differently.  Hence, in my view, the waste tonnage should be included when reporting mineral resource tonnages (or presenting grade-tonnage data) within a constraining shell.  This waste tonnage or strip ratio can be in the footnotes to the mineral resource summary table.

Spider Diagram Downsides

In 43-101 technical reports, the financial Chapter 22 normally presents the project sensitivities expressed in a spider diagram or a table format.
In a previous blog post I had discussed the flaws in the spider diagram approach.  That article link is at “Cashflow Sensitivity Analyses – Be Careful”.  The grade-tonnage curve helps explain why that is.
In the spider diagrams, we typically see sensitivities related to +/- 20% on metal prices and operating costs.    If either of these factors change, then in reality the cutoff grade would change.
If the metal price decreases by -20%, or the operating cost climbs by +20%, the cutoff grade must increase.  This adjustment is normally not made in the sensitivity analysis because it requires a lot of re-work.
Elevating the cutoff grade would shift the pit ore tonnage towards the right on the grade-tonnage curve, showing a decrease in mineable tonnes.   However, in the spider diagram logic, the assumption is that production schedule in the cashflow model is unchanged and simply the metal prices or operating costs are adjusted.  Therefore, the spider diagram can be a misleading representation of the downside risk, showing a more positive situation than in reality.

Conclusion

The grade-tonnage information is always presented in technical reports. It examines the sensitivity of the orebody size to changes in cutoff grade. The next time you see grade-tonnage data, don’t skip over it.  Take a minute to study it further to see what can be learned.
Note: You can sign up for the KJK mailing list to get notified when new blogs are posted. Follow me on Twitter at @KJKLtd for updates and other mining posts.   The entire blog post library can be found at https://kuchling.com/library/
Share

Mining Under Lakes – Part 2: Design Issues

This is Part 2 of a blog post related to open pit mining within bodies of water. Part 1 can be found at this link “Mining Under Lakes – Part 1“, which provides a few examples where this has been done successfully. Part 2  focuses on some of the social and technical issues the need to be considered when faced with the challenge of open pit mining within a water body.
dike construction in waterThe primary question to be answered is whether one can mine safely and economically without creating significant impacts on the environment.
The answer to this question will depend on the project location and the design of the water retaining structure.
I have worked on several projects where dike structures were built. I have also undertaken due diligence reviews of projects where dikes would be required. Most recently I have participated in some scoping level studies where mining within a lake or very close to a river were part of the plan.
In some instances, the entire orebody is located in the lakebed. In others, the orebody is mainly on land but extends out into the water. Each situation will be unique. In northern Canada, given the number of lakes present, it would be surprising if a new mining project isn’t close to a river or lake somewhere.

Dike concepts consider many factors

Different mining projects may use different styles of dikes, depending on their site conditions. Some dikes may incorporate sheet piling walls, slurry cutoff walls, low permeability fill cores, or soil grouting. There are multiple options available, and one must choose the one best suited for the site.
The following is list of some of the key factors and issues that should be examined.

ESG Issues

One’s primary focus should be on whether building a dike would be socially and environmentally acceptable. If it is not, then there is no point in undertaking detailed geotechnical site investigations and engineering design. One must have the “social license” to proceed down this path.
Water Body Importance: Is there a public use of the water body? It could be a fresh water source for consumption, used for agricultural or fishery purposes, or used as a navigable waterway, etc. Would the presence of the dike impact on any of these uses? Does the water body have any historical or traditional significance that would prevent mining within it?
Lake Turbidity: Dike construction will need to be done through the water column. Works such as dredging or dumping rock fill will create sediment plumes that can extend far beyond the dike. Is the area particularly sensitive to such turbidity disturbances, is there water current flow to carry away sediments?
At Diavik, a floating sediment curtain surrounding the dike construction area was largely able to contain the sediment plume in the lake.
Regional Flow Regime: Will the dike be affecting the regional surface water flow patterns? If the dike is blocking a lake outflow point, can the natural flow regime be maintained during both wet and dry periods?

Location Issues

If there are no ESG issues preventing the use of a dike, the next item to address is the ideal location for it.
Water depth: normally as the dike moves further away from land, both the water depth and dike length will increase. The water depth at the deepest points along the dike are a concern due to the hydraulic head differential created once the interior water pool is pumped out. The seepage barrier must be able to withstand that pressure differential, without leaking or eroding. A low height dike in shallow water may be able to use a simpler seepage cutoff system than a dike in deep water.
Islands: Are there any islands located along the dike path that can be used to shorten the construction length and reduce the fill volumes? Is there a dike alignment path that can follow shallower water zones?
Diavik open pit dikes
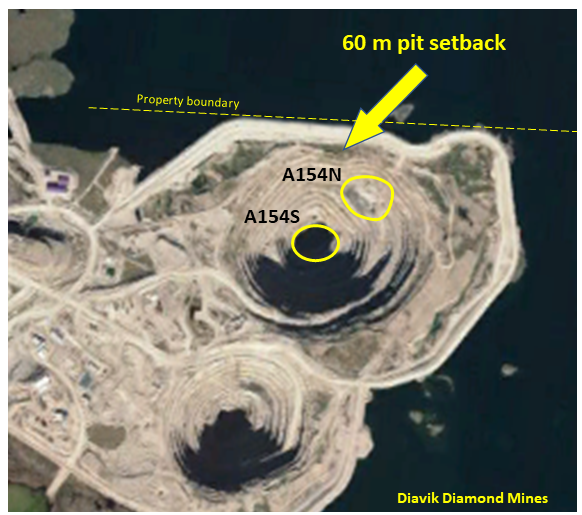
Pit wall setback: Given the size and depth of the open pit, how far must the dike be from the pit crest? Its nice to have 200 metre setback distance, but that may push the dike out into deeper water.
If the dike is too close to the pit, then pit slope failures or stress relaxation may result in fracture opening and increase the risk of seepage flows or catastrophic flooding. The pit wall rock mass quality will be the key determining factor in the setback distance.
Maximizing ore recovery: If the ore zone extends further out into the lake, maximizing ore recovery may require using a steep pit wall along the outer sections of the pit. This may require positioning haulroads with switchbacks along other sides of the pit rather than using a conventional spiral ramp layout.
At Diavik (see image), the A154 north open pit wall was pushed to about 60 metres of the dike to access as much of the A154N kimberlite ore as possible. Haulroads were kept to the south side of the pit.
It may be possible to recover even more ore by pushing out the dike even further. However, this may result in a larger and costlier dike or even require a different style of dike. There will be a tradeoff between how much additional ore is recovered versus the additional cost to achieve that. There will be a happy medium between what makes both technical sense and economic sense.

Design Issues

Once the approximate location of the dike has been identified, the next step is to examine the design of the dike itself. Most of the issues to be considered relate to the geotechnical site conditions.
Lakebed foundation sediments: What does the lakebed consist of with respect to soft sediments? Soft sediments can cause dike settlement and cracking, or mud-waving of fill material.
Will the soft sediments need to be dredged prior to construction, and if so, where do you dispose of this dredge slurry, and what impact will dredging have on the lake turbidity?
Lakebed foundation gravels: Are there any foundation gravel layers that can act as seepage conduits beneath the dike? If so, will these need to be sub-excavated, or grouted, or cut off with some type of barrier wall?  Sonic drilling, rather than core drilling, is a better way to identify the presence of open gravel beds.
Upper bedrock fracturing: Is the upper bedrock highly fractured, thereby creating leakage paths? If so, then rock grouting may be required all along the dike path to seal off these fractures.
Major faults: Are there any major faults or regional structures that could connect the open pit with the lake, acting as a source of large water inflow?. At Diavik, we attempted to characterize such structures with geotechnical drilling before construction. Upon review, I understand there was one such structure not identified, which did result in higher pit inflows until it was eventually grouted off.
Water level fluctuations: In a lake or river one may see seasonal water level fluctuations as well as storm event fluctuations. The height of the dike above the maximum water level (i.e. freeboard) must be considered when sizing the dike.
Ice scouring: In a lake or river that freezes over, ice loads can be an important consideration. During spring breakup as the ice melts, large sheets of ice can be pushed around and may scour or damage the crest of the dike. The dike must be robust enough to withstand these forces.
Construction materials available on site: Is there an abundance of competent rock for dike fill? Is there any low permeability glacial till or clay that can be used in dike construction? If these materials are available on site, the dike design may be able to incorporate them. If such materials are not available, then a alternate dike design may be more appropriate, albeit at a cost.

Conclusion

Each mine site is different, and that is what makes mining into water bodies a unique challenge. However many mine operators have done this successfully using various approaches to tackle the challenge.
Even at the exploration stage, while you are still core drilling the orebody through the ice, you can start to collect some of this information to help figure it all out.
The bottom line is that while mining into a water body is not a preferred situation, it doesn’t mean the project is dead in the water. It will add capital cost and environmental permitting complexity, but there are proven ways to address it.
On the opposite side, I have also seen situations where a dike solution was not feasible, so ultimately there are no guarantees that engineers can successfully address every situation. Lets hope your project isn’t one of them.
There could be a 3rd part to this post that discusses issues associated with underground mining beneath bodies of water; however that is not my area of expertise.  I would be more than happy to collaborate on a article with someone willing to share their knowledge and experience on that subject.
Note: You can sign up for the KJK mailing list to get notified when new blogs are posted. Follow me on Twitter at @KJKLtd for updates and other mining posts. The entire blog post library can be found at https://kuchling.com/library/
Share

NPV One – Cashflow Modelling Without Excel

NPV One mining software
From time to time, I encounter interesting software applications related to the mining industry.  I recently became aware of NPV One, an Australian based, cloud hosted application used to calculate mineral project economics. Their website is https://npvone.com/npvone/
NPV One is targeting to replace the typical Excel based cashflow model with an online cloud model. It reminds me of personal income tax software, where one simply inputs the income and expense information, and then the software takes over doing all the calculations and outputting the result.
NPV One may be well suited for those not comfortable with Excel modelling, or not comfortable building Excel logic for depreciation, income tax, or financing calculations. These calculations are already built in the NPV One application.
I had a quick review of NPV One, being given free access to test it out. I spent a bit of time looking at the input menus and outputs, but by no means am I proficient in the software after this short review.
Like everything, I saw some very good aspects and some possible limitations. However, my observations may be a bit skewed since I do a lot of Excel modelling and have a strong comfort level with it. Nevertheless, Excel cashflow modelling has its own pro’s and con’s, some of which have been irritants for years.

NPV One – Pros and Cons

NPV One mining softwarePros

  1. NPV One develops financial models that are in a standardized format. Models will be very similar to one another regardless of who creates it. We are familiar with Excel “artists” that have their own modelling style that can make sharing working models difficult. NPV One might be a good standard solution for large collaborative teams looking at multiple projects while working in multiple offices.
  2. NPV One, I have been assured, is error free. A drawback with Excel modelling is the possibility of formula errors in a model, either during the initial model build or by a collaborator overwriting a cell on purpose (or inadvertently).
  3. With NPV One, a user doesn’t need to be an Excel or tax modelling expert to run an economic analysis since it handles all the calculations internally.
  4. NPV One allows the uploading of large input data sets; for example life-of-mine production schedules with multiple ore grades per year. This means technical teams can still generate their output (production schedules, annual cost summaries, etc.) in Excel. They can then simply import the relevant rows of data into NPV One using user-created templates in CSV format.
  5. As NPV One evolves over time with more client input, functionality and usability may improve as new features are added or modified.

Cons

Like anything, nothing is perfect and NPV may have a few issues for me.
  1. Since I live and breathe with Excel, working with an input-based model can be uncomfortable and take time to get accustomed to. Unlike Excel, in NPV One, one cannot see the entire model at once and scroll down a specific year to see production, processing, revenue, costs, and cashflow. With NPV jump to. If you’re not an avid Excel user, this issue may not be a big deal.
  2. In Excel one can see the individual formulas as to how a value is being calculated.  Excel allows one to follow a mathematical trail if one is uncertain which parameters are being used. With NPV One the calculations are built in. I have been assured there are no errors in NPV One, so accuracy is not the issue for me. It’s more the lack of ability to dissect a calculation to learn how it is done.
  3. With NPV One, a team of people may be involved in using it. That’s the benefit of collaborative cloud software. However that means there will be a learning curve or training sessions that would be required before giving anyone access to the NPV One model.  Although much of NPV One is intuitive, one still needs to be shown how to input and adjust certain parameters.
  4. Currently NPV One does not have the functionality to run Monte Carlo simulations, like Excel does with @Risk. I understand NPV One can introduce this functionality if there is user demand for it. There will likely be ongoing conflict to try to keep the software simple to use versus accommodating the requests of customers to tailor the software to their specific needs.

Conclusion

The NPV One software is an option for those wishing to standardize or simplify their financial modelling.
Whether using Excel or NPV One, I would recommend that a single person is still responsible for the initial development and maintenance of a financial model. The evaluation of alternate scenarios must be managed to avoid it becoming a modelling team free for all.
Regarding the cost for NPV One, I understand they are moving away from a fixed purchase price arrangement to a subscription based model. I don’t have the details for their new pricing strategy as of May 2023. Contact Christian Kunze (ck@npvone.com) who can explain more, give you a demo, and maybe even provide a trial access period to test drive the software.
To clarify I received no compensation for writing this blog post, it is solely my personal opinion.
Regarding Excel model complexity mentioned earlier, I have written a previous blog about the desire to keep cashflow models simple and not works of art. You can read that blog at Mine Financial Modelling – Please Think of Others”.
As with any new mining software, I had also posted some concerns with QP responsibilities as pertaining to new software and 43-101. You can read that post at the appropriately titled “New Mining Software and 43-101 Legal Issues”.


Note: You can sign up for the KJK mailing list to get notified when new blogs are posted. Follow me on Twitter at @KJKLtd for updates and other mining posts. The entire blog post library can be found at https://kuchling.com/library/


Share

Steeper Pit Slopes Can Save Money

We likely have all heard the statement that increasing pit wall angles will result in significant cost savings to the mining operation.
What is the potential cost saving?
The steeper wall angles reduce waste stripping volumes, which also provide other less obvious benefits.
I was recently in a situation where we undertook some comparative open pit designs using both 45 and 50 degree inter-ramp angles (“IRA”). I would like to share some of those results and discuss where all the benefits may lay.

Comparative Pit Designs

In this project, four separate open pits were designed with 45 and 50 degree IRA’s in an area with hilly topography. Some of the pits had high walls that extended up the valley hillsides. Its not hard to envision that waste stripping reductions would be seen along those areas with steepened walls.
The results of applying the increased  inter-ramp angle to each of the four pits is shown in the Bar Chart. Note that the waste reduction is not necessarily the same for each pit.  It depends on the specific topography around each pit.
However, on average, there was an overall 15% reduction in waste tonnage.
The Table shown below presents the cumulative tonnage for all four pits. The 50 degree wall results in a waste decrease of 25.4 million tonnes (15%), with a strip ratio reduction from 5.8:1 to 5.0:1.
There is also a very minor decrease in ore tonnage. This is because the 50 degree slopes did lose some ore behind the walls that is being recovered by the 45 degree slope.
In both scenarios the project life would be about 10 years at an assumed ore processing rate of 3 Mtpa.

4 Positive Impacts of Steeper Walls

In general one can typically see four positive outcomes from adopting steeper pit walls. They are as follows:
1. Cost Savings: The waste tonnage reduction over the 10 year life would be about 25.4 million tonnes. At a mining cost of $2.00/tonne, this equates to $50.8 million tonnes spent less on stripping. This could move the project NPV from marginal to profitable, since most waste is normally stripped towards the front part of the mining schedule with less discounting.
The next time you are looking at the NPV from an open pit project, take a quick look to see if the pit slope assumptions are conservative or optimistic. That decision can play a significant role in the final NPV.
2. Equipment Fleet Size: Over the 10 year life, the average annual mining rate would range from 20.5 Mtpa (45 deg) to 18.1 Mtpa (50 deg). On a daily basis, the average would range from 56,100 tpd (45 deg) versus 49,700 tpd (50 deg). While this mining rate reduction is not likely sufficient to eliminate a loader, it could result in the elimination of a truck or two.   This would have some capital cost saving.
3. Waste Dump Size: The 15% reduction in the waste tonnage means external waste dumps could be 15% smaller. This may not have a huge impact but could be of interest if waste storage sites are limited on the property. It could have a more significant impact if local closure regulations require open pit backfilling.
4. Pit Crest Location: The steeper wall angles result in a shift in the final pit crest location. The Image shows the impact that the 5 degree steepening had on the crest location for one of the pits in this scenario.
Although in this project the crest location wasn’t critical, there are situations where rivers, lakes, roads, mine facilities, or public infrastructure are close to the pit.  A steeper wall could improve ore recovery at depth while maintaining the same buffer setback distance.

Conclusion

Steeper pit walls can have multiple benefits at an open pit mining operation. However, these benefits can all be negated if the rock mass cannot tolerate those steeper walls. Pit wall failures could be minor or they could have major impacts. There are the obvious worker safety issues, as well as equipment damage and production curtailment concerns with slope failures.  Public perception of the mining operation also comes into play with dangerously unstable slopes.
Steepening of the pit walls is great in theory, but always ensure that geotechnical engineers have confirmed it is reasonable.
It is relatively easy to justify spending additional time and money on proper geotechnical investigations and geotechnical monitoring given the potential slope steepening benefits.
When designing pits, there is some value in looking at alternate designs with varying slope angles to help the team understand if there are potential gains and how large they might be.
In closing, I previously wrote a related blog post about how pit walls are configured to ensure safe catch bench widths and decisions as to whether one should use single, double, or triple benching. That earlier post can be read at this link. Pit Wall Angles and Bench Widths – How Do They Relate?
Feel free to share your personal experiences if you are aware of other benefits (or even downsides) to steeper pit walls that I did not mention.
Note: You can sign up for the KJK mailing list to get notified when new blogs are posted. Follow me on Twitter at @KJKLtd for updates and other mining posts.
Share

Life as an Engineer – Read All About It

One of the interesting aspects of being an engineer in the mining industry is travelling around the globe (or even) around your own country. I have been to over a dozen countries as part of my career and this only makes me a small-time traveller compared to other engineers I know. Travelling and experiencing the world is often part of the job, whether working for a junior miner, a major, a financial house, a consulting firm, or an equipment vendor. It is actually quite difficult to avoid travel if you work in mining.

Diavik Project

Recently a former colleague of mine on the Diavik Diamond Diavik project has published book that describes his life as an engineer. The book is titled Roseway: a Life of Adventure and is available on Amazon.
Its the story of John Wonnacott, a Canadian professional engineer who was involved in the construction of several projects, including the Diavik Diamond mine in Canada, a nickel smelter in China, a gold mine in Brazil, and a titanium mine in Madagascar to list a few.
John has a broad background, having conducted engineering studies in the jungles of Indonesia, the cold of Greenland, the sands of the desert, the heat of Australia, the altitude of the Andes. He has documented his engineering career in his new book.
Disclaimer: I have not yet read the book since it has only recently been published. However John has kindly sent me some excerpts that I have reprinted below to provide everyone with a sense for the content and style.

Some Excerpts

Introduction

At one time or another, I have been a professional paper-boy, forest worker, tree planter, market gardener, food processing equipment operator, lobster fisherman’s helper, commercial dragger deckhand, short-order cook, military engineering officer, computer system installer, greenhouse worker, permafrost researcher, marine oil spill cleanup specialist, pyrometallurgy researcher, garbage landfill operator, project manager, construction company general manager, regional director, open pit diamond miner, underground gold miner, corporate vice-president, design consultant, company owner, private corporation president and for 50 years, a damn good engineer. I have also been happily married to my wonderful wife Carole Anne for more than 52 years and we have 2 outstanding children. So I can add “husband”, “father” and “grandfather” to the list – but making lists like this is boring. Let me tell you my story.

Newfoundland

I remember in the late fall of that year, the company had a chance to bid on a larger project in Gros Morne National Park, Newfoundland. So our President, Frank Nolan (he was a brother to Fred Nolan, the infamous land-owner at Oak Island, by the way), decided he wanted to see the site and he chartered a Bell 106 helicopter to fly us there from Deer Lake. It was December (they say “December month” in that province) and when we got close to the Park, we ran into a sudden snow squall.
From bright sunny weather we were suddenly flying in heavy wet snow. I was sitting in the back of the chopper, with Frank sitting in the left front passenger seat. We were chatting with the pilot, via the radio headsets, when suddenly there was a loud “BEEP BEEP BEEP” sound coming from the front of the aircraft, and a number of the instrument lights started flashing. The engine had cut out – we learned later that wet snow had blocked the air intake and the engine had stalled – and we started descending pretty fast. Most people don’t realize that a helicopter will glide (quite steeply, at a glide angle of about 10 to 1) provided the pilot gets the torque off the rotor and he makes the correct feathering adjustments.
Our pilot did that instinctively and when we passed through the squall he calmly explained to us what was happening as he looked around for an open, flat spot to land. We didn’t have many options as we were flying over a densely wooded forest, with the mountains of Gros Morne and a deep fiord up ahead. But the pilot spotted a snow-covered frozen bog that was not a lot bigger than the helicopter and he put us down there as smoothly as if the engine hadn’t stopped. Maybe the deep snow cushioned our impact, because I felt nothing. But the instant we landed, Frank Nolan wrenched his door open, and he bolted out of the machine, straight ahead, in front of us.
The rotor was still spinning rapidly, and just as Frank ran ahead, the chopper settled further into the snow, tilting the machine forward in the process. With the chopper blades almost skimming the top of the snow, both the pilot and I expected Frank to be cut into pieces by the rotor, but he was just past their reach and he ran on, unaware of his narrow escape. When the spinning parts stopped, the pilot and I climbed out of the chopper to catch up with Frank. Examination of the machine showed us how the snow had plugged the air intake. The pilot cleared away the snow, and walked around the chopper once and then we took off again. We continued our aerial inspection of the National Park project and later that afternoon we flew back to Deer Lake.

Madagascar

The QMM field office In Port Dauphin, Madagascar was located near the edge of town, and I typically walked from my lodging to the office each morning when I was there, about the time when school started for the children. Typically I passed dozens and dozens of tiny bamboo huts with corrugated metal roofs, and dirt floors each about 2 meters square.
I was constantly amazed by the flocks of young boys and girls walking to school – each child aged from 6 to 15 years old, I suppose – dressed in immaculate white shirt or blouse and blue shorts or skirts. I never saw a dirty child, and how they could have kept clean clothes while living in those small crude huts was something I never could figure out. Even more amazing, were the genuine, wide smiles and frequent greeting as we passed the children: “bonjour monsieur, bonjour monsieur”.
It brings tears to my eyes even now, thinking about those children. If they were girls, they could look forward to a life expectancy of 48 years, according to the town officials we talked to. If they were boys, they could expect to live to an age of only 40 years. The perils of fishing in the ocean in dugout canoes made life even harder for the men.
The next morning, we arrived at the Astana international airport, to find that the check-in arrangements were quite different from what we were used to. Instead of checking our luggage at a desk and then walking through Security to get to our departure gate, everyone was expected to wheel their luggage and handbags through security, as the airline check-in desks were located inside.
The mechanics of rustling our luggage weren’t difficult, but as I passed through the check-point, suddenly a strange-sounding alarm went off. As the alarm rang and rang, my mind raced – what did I have in my bag that would trigger the alarm, I wondered? It didn’t help that the Security guards only spoke Russian, and they were dressed in military uniforms with ridiculously large military caps, which made them look imposing (and silly). But what began to worry me more, was that the look on the Security guards’ faces was not the usual one that happens when a piece of metal sets off an alarm. The guards looked frightened and angry, at the same time.
Fortunately for us, the commotion caught the attention of the clerks at the Turkish Airlines desk inside the terminal building, and one English-speaking fellow approached, speaking to the security guards in Russian first, then saying to us: “I speak English, may I help”? Well, he helped, but it took a while, because it turned out that a rarely used hidden nuclear radiation detector had been triggered when I came through the gate, and the guards were concerned that I had some kind of radioactive material in my suitcase.
For a moment my mind went blank, and then I remembered a card that I was carrying in my wallet. I had had a bout of prostate cancer the previous fall, and my brachytherapy treatment had involved inserting over a hundred tiny radioactive pellets in and around my prostate – designed to kill the cancer. The pellets decay naturally in a fairly short time, and by now, 9 or 10 months after my operation, I would have bet that the radioactive material had all decayed to an undetectable level. But my doctor had given me a card to carry, which explained the medical procedure, just for circumstances like this. When I pulled out the card, it was like a “Get out of Jail Free Card” from the Monopoly game. Instantly the guards’ attitudes changed from fear and suspicion, to sympathy and smiles. One of the big fellows wheeled my luggage over to the Turkish Airlines desk where the Good Samaritan clerk reverted back to his normal job of checking us in.

**** end of excerpt ****

Conclusion

It is one thing to briefly visit a remote project as part of a review team. It is another thing to be there as part of a design team trying to solve a problem and engineer a solution. I know of many engineers and geologists that would have similar work life experiences as part of their careers. However John has taken the initiative to write it all down.
The author is available to be contacted on LinkedIn if you have any questions or just want to say hello (at https://www.linkedin.com/in/john-wonnacott-84aa461a/).
The book can be found on Amazon at this link: Roseway: a Life of Adventure.
This is a story from the life of an experienced engineer working in the mining industry.  If you want to read the perspective from a new mining engineer graduate, check out this post “A Junior EIT Mining Story“.   There is no book deal yet here.
If you find stories about working as an engineer of interest, I have written a 2 part blog post on my adventures in the potash industry in Saskatchewan.  You can read that post at this link “Potash Stories from 3000 Feet Down – Part 1
Note: You can sign up for the KJK mailing list to get notified when new blogs are posted. Follow me on Twitter at @KJKLtd for updates and other mining posts.
Share

Resources, Resources, and Mineral Reserves

Every so often I like to comment on issues related to the way the mining industry does things. This is one of those posts.
Currently the mining industry reports their exploration results as either Mineral Resources or Mineral Reserves. In my opinion, these two categories do not adequately reflect the reality of the current mining environment. I would suggest using a three category approach, as will be described below.
The implementation of this approach would not result in any more technical effort. However, it would provide clarity for stakeholders and investors and compare companies on a more equitable basis.

The issue

In today’s world, it is an onerous task to permit, finance, build, and operate a new mine. This is a significant achievement.
An operating company will be generating revenue and should be recognized for that big step. Hence does it make sense for an operating company to report Mineral Reserves while a junior company that has simply completed a pre-feasibility study to also report Mineral Reserves?
Both companies could report identical Reserves, but those reserves would not be the same thing. One company has built a mine while the other may have spent a few months doing a paper study. One company’s reserves will actually be mined in the foreseeable future while the other company’s project may never see the light of day. Yet both companies are allowed to present the same Mineral Reserves.
As a mine operates, the remaining ore reserves will deplete over time. However, a company can add to their reserves by finding satellite ore bodies or converting inferred material into a higher classification. The net of these adjustments will be reflected in the corporate Mineral Reserve Statement for all their operations.
A company can also increase the corporate Mineral Reserves simply by completing a pre-feasibility or feasibility study on a new project. However, is this a true reflection of the Reserves upon which the company should be evaluated?

Suggestion

I would suggest that the three reporting categories be used instead of two, described as follows:
1 – Mineral Resources (insitu): This category is the same as the current Mineral Resources being reported according to NI43-101. It is based on reasonable prospects for economic extraction. Hence open pit resources would be reported within an optimized shell and underground reserves within approximate stope shapes. No external dilution or mining criteria would be applied, as is the current approach.
2 – Economic Resources: This would be a new category that would simply be the outcome from a pre-feasibility or feasibility study, which is currently being labelled a “Mineral Reserve”. This Economic Resource would incorporate mining criteria, Measured & Indicated classes only, a mine plan, and an economic analysis. The differentiation from Reserves is because the mine is not built yet.
3 – Mineral Reserves: This highest-level category could be reported only once a mine has reached commercial production. The Economic Resources would automatically convert to Mineral Reserves once production is achieved. As the mine continues to operate, and as new ore sources are identified, the Mineral Reserves would increase / decrease. The Mineral Reserves would represent the remaining ore tonnage at operating mines and only that.
This three-category approach would help separate mine operators from junior development companies. The industry should recognize the difference between companies and projects at different life-cycle stages and that they are not all directly comparable. A junior explorer could be reporting huge reserves, but without a mine being there, should that company be compared to a mine operator that has similar reserves?
This approach would identify situations whereby a company suddenly reports a sizeable increase in Reserves. Is it because they found more ore at an existing operation (a great event) or because they did a paper study on a new project?
As a clarification, if a mine gets placed onto care & maintenance, likely due to poor economics, then the remaining tonnes at the mine would no longer be considered Mineral Reserves and may have to revert to Economic Resources, although even that would be questionable.

Examples

Out of curiosity I randomly selected three companies (Yamana Gold, Eldorado Gold, Alamos Gold) to compare their total Mineral Reserve tonnages based on their operations versus study stage development projects. The results are show in the images below. The percentage of Reserves provided by their producing (P) mines varied and ranged from 14% to 51%. A significant proportion of their Reserves (49% to 86%) are still at the development (D) stage. One or two large study-stage projects can boost the corporate reserves significantly. This is not immediately evident when looking at the total Mineral Reserves being reported.
For most junior miners 100% of their Reserves are still at the study-stage. They should not be able to declare Mineral Reserves and appear on an equal footing with mine operators. Their company should only be comparable to other companies with advanced study-stage projects.
Blog 97 Charts

Conclusion

The foregoing discussion is a suggestion as to how the mining industry can recognize the achievement and economic reality of building a mine, i.e. by being allowed to report Mineral Reserves. All others only get to report Resources. This would help clarify what long term tonnages are actually being mined versus simply being studied on paper.
The suggested approach does not create additional work for the mining companies. However, it provides a much fairer and transparent comparison between companies.
Interestingly, NI43-101 specifies that one cannot mathematically add together Indicated and Inferred resources because they are view as materially different. However, in a corporate Mineral Reserve Statement one is allowed to combine Reserves at an operating mine with Reserves from a study.  These two reserves, in my view, are even more materially different than Indicated and Inferred resources are.
Its great for a company to report Mineral Reserves from a pre-feasibility study.  However if for some reason that mine never gets built, then those Reserves are valueless. Maybe years ago it was foregone conclusion that a positive feasibility study would result in the construction of a mine, so the risk was less. That is no longer the case and this fact should be recognized when defining and reporting Mineral Reserves.
Note: You can sign up for the KJK mailing list to get notified when new blogs are posted. Follow me on Twitter at @KJKLtd for updates.
Share