Articles tagged with: 43-101

Mining Due Diligence Checklist

It doesn’t matter how long you have worked in the mining industry, at some point you will probably take part in a due diligence review. You might have been asked to help create a data room. Perhaps your company is looking at a potential acquisition. Maybe you’re a consultant with a particular expertise needed by a due diligence team. It’s likely that due diligence has impacted on many of us at some point in our careers.
The scope of a due diligence can be exceptionally wide. There are legal, marketing, and environmental aspects as well as all the technical details associated with a mining project. The amount of information provided can be overwhelming.

Checklists are great

Checklists are great and can be very helpful in a due diligence review. A detailed technical scope checklist is a great way to make sure things don’t fall through the cracks. A checklist helps keep a team on the same page and clarifies individual roles and tasks. Checklists bring focus and minimize sidetracking down unnecessary paths.
Recognizing this, I have created a personal due diligence checklist for these exercises. A screen shot of it is shown below. The list is mainly tailored for an undeveloped mining project still at the study stage, but it still has over 230 items that might need to be considered.

Every mining due diligence is unique

Not all of the items in the checklist are required for each review. Maybe you’re only doing a high level study to gauge management’s interest in a project. Maybe you’re undertaking a detailed review for an actual acquisition or financing event. It’s up to you to create your own checklist and highlight which items need to be covered off. The more items added the less risk of missing something in the end.
You a create your own checklist but if you would like a copy of mine just email me at KJKLTD@rogers.com and let me know a bit about how you plan to use it (for my own curiosity). Specify if you would prefer the Excel or PDF versions.
Please let me know if you see any items missing or if you have any comments.

Due Diligence isn’t for everyone

Mining due diligence exercises can be interesting and great learning experiences, even for senior people that have seen it all. However they can also be mentally taxing due to the volumes of information that one must find, review, and comprehend, all in a short period of time.
Some people are better at due diligence than others. It helps if one has the ability to quickly develop an understanding of a project. It also helps to know what key things to look for, since many risks are common among projects.
Further on the topic of mining due diligence, I have a previous blog post triggered by my frustrations with some poorly set up data rooms.  You can read that at “Due Diligence Data Rooms – Help!”  My request is that when setting up a mining data room, please think about the people who will be using it.
Note: If you would like to get notified when new blogs are posted, then sign up on the KJK mailing list on the website.  Otherwise I post notices on LinkedIn, so follow me at: https://www.linkedin.com/in/kenkuchling/.
Share

Mining Dilution Prediction – Its Not That Simple

mining reserve estimation
Over my years of working on and reviewing mining studies, ore dilution often seems to be one of the much discussed issues.  It is deemed either too low or too high, too optimistic or too pessimistic.  Project economics can see significant impacts depending on what dilution factor is applied.  They are numerous instances where mines have been put into production, and excess dilution has subsequently led to their downfall.  Hence we need to take the time to think about what dilution is being applied and the basis for it.

Everyone has a preferred dilution method.

I have seen several different approaches for modelling and applying dilution.   It seems that engineers and geologists have their own personal favorites and tend to stick with them.   Here are some common dilution approaches that I have seen (and used myself).
1. Pick a Number:
This approach is quite simple.  Just pick a number that sounds appropriate for the orebody and the mining method.  There might not be any solid technical basis for the dilution value, but as long as it seems reasonable, it might go unchallenged.  Possibly its a dilution value commonly seen in numerous other studies.
2. SMU Compositing:
This approach takes each percent block (e.g.  a block is 20% waste and 80% ore) and mathematically composites it into a single Selective Mining Unit (“SMU”) block with an overall weighted average grade.  The SMU compositing approach will dilute the ore in the block with the contained waste.  Ultimately that might convert some highly diluted ore blocks to waste once a cutoff grade is applied.   Some engineers may apply an additional dilution percentage beyond the SMU compositing, while others will consider the blocks fully diluted at this step.
3. Diluting Envelope:
This approach assumes that a waste envelope surrounds the ore zone.  One estimates the volume of this envelope on different benches, assuming that it is mined with the ore.  The width of the waste envelope may be linked with the blast hole spacing used to define the ore and waste contacts for mining.  The diluting grade within the waste envelope can be estimated or one may simply assume a more conservative zero-diluting grade.   In this approach, the average dilution factor can be applied to the final production schedule to arrive at the diluted tonnages and grades sent to the process plant.
4. Diluted Block Model:
This dilution approach uses complex logic to look at individual blocks in the block model, determine how many waste contact sides each block has, and then mathematically applies dilution based on the number of contacts.  A block with waste on three sides would be more heavily diluted than a block with waste only on one side.   Usually this approach relies on a direct swap of ore with waste.  If a block gains 100 m3 of waste, it must then lose 100 m3 of ore to maintain the volume balance.   The production schedule derived from a “diluted” block model usually requires no subsequent dilution factor.
5. Using UG Stope Modelling
I have also heard about, but not yet used, a method of applying open pit dilution by adapting an underground stope
modelling tool.  By considering an SMU as a stope, automatic stope shape creators such as Datamine’s
Mineable Shape Optimiser (MSO) can be used to create wireframes for each mining unit over the entire
deposit. Using these wireframes, the model can be sub-blocked and assigned as either ‘ore’ (inside the
wireframe) or ‘waste’ (outside the wireframe) prior to optimization.   It is not entirely clear to me if this approach creates a diluted block model or generates a dilution factor to be applied afterwards.


When is the Cutoff Grade Applied?

Depending on which dilution approach is used, the cutoff grade will be applied either before or after dilution.   When the dilution approach requires adding dilution to the final production schedule, then the cutoff grade will have been applied to the undiluted material (#1 and #2).
When dilution is incorporated into the block model itself (#3 and #4), then the cutoff grade is likely applied to the diluted blocks.
The timing of when the cutoff grade is applied to the ore blocks will have an impact on the ore tonnes and had grade being reported.

Does one apply dilution in pit optimization?

Another occasion when dilution may be used is during pit optimization.  In the software, there are normally input fields for both a dilution factor and an ore loss factor.   Some engineers will apply dilution at this step while others will leave the factors at zero.  There are valid reasons for either approach.
My preference is use a zero dilution factor for optimization since the nature of the ore zones will be different at different revenue factors and hence dilution would be unique to each.   It would be good to verify the impact that the dilution factor has on your own pit optimization by running with a factor to see the result.

Conclusion

My personal experience is that, from a third party review perspective, reviewers tend to focus on the value of the  dilution percentage used and whether it seems reasonable.   The actual dilution approach tends to get less focus.
Regardless of which approach is being used, ensure that you can ultimately determine and quantify the percent dilution being applied.  This can be a bit more difficult with the mathematical block diluting approaches.
Readers may yet have different dilution methods in their toolbox and I it would be interesting to share them.
There is another blog post that discussed dilution from an underground mining perspective.  This discussion was written by another engineer who permitted me to share their paper.    You can read that at “Ore Dilution – An Underground Perspective“.
The entire blog post library can be found at this LINK with topics ranging from geotechnical, financial modelling, and junior mining investing.
Note: If you would like to get notified when new blogs are posted, then sign up on the KJK mailing list on the website.  
Share

Disrupt Mining Challenge – Watch for it at PDAC

Update:  This blog was originally written in January 2016, and has been updated for Jan 2018.

Gold Rush Challenge

In 2016 at PDAC, Integra Gold held the first the Gold Rush Challenge.  It was an innovative event for the mining industry.  It was following along on the footsteps of the Goldcorp Challenge held way back in 2001.
The Integra Gold Rush Challenge was a contest whereby entrants were given access to a geological database and asked to prepare submissions presenting the best prospects for the next gold discovery on the Lamaque property.  Winners would get a share of the C$1 million prize.
Integra Gold hoped that the contest would expand their access to quality people outside their company enabling their own in-house geological team to focus on other exploration projects.   In total 1,342 entrants from over 83 countries registered to compete in the challenge.  A team from SGS Canada won the prize.

Then Disrupt Mining came along

In 2017, its seem the next step in the innovation process was the creation of Disrupt Mining sponsoerd by Goldcorp.  Companies and teams developing new technologies would compete to win a $1 million prize.
In 2017, the co-winning teams were from Cementation Canada (new hoisting technology) and Kore Geosystems (data analystics for decision making).
In 2018, the winning team was from Acoustic Zoom, an new way to undertake seismic surveys.

The 2019 winners will be announced at PDAC.  The entry deadline has passed so you’re out of luck for this year.

Conclusion

At PDAC there are always a lot of things to do, from networking, visiting booths, presentations, trade shows, gala dinners, and hospitality suites.
Now Disrupt Mining brings another event for your PDAC agenda.
Note: You can sign up for the KJK mailing list to get notified when new blogs are posted.
Share

Measured vs. Indicated Resources – Do We Treat Them the Same?

measured and indicated
One of the first things we normally look at when examining a resource estimate is how much of the resource is classified as Measured or Indicated (“M+I”) compared to the Inferred tonnage.  It is important to understand the uncertainty in the estimate and how much the Inferred proportion contributes.   Having said that, I think we tend to focus less on the split between the Measured and Indicated tonnages.

Inferred resources have a role

We are all aware of the regulatory limitations imposed by Inferred resources in mining studies.  They are speculative in nature and hence cannot be used in the economic models for pre-feasibility and feasibility studies. However Inferred resource can be used for production planing in a Preliminary Economic Assessment (“PEA”).
Inferred resources are so speculative that one cannot legally add them to the Measure and Indicated tonnages in a resource statement (although that is what everyone does).   I don’t really understand the concern with a mineral resource statement if it includes a row that adds M+I tonnage with Inferred tonnes, as long as everything is transparent.
When a PEA mining schedule is developed, the three resource classifications can be combined into a single tonnage value.  However in the resource statement the M+I+I cannot be totaled.  A bit contradictory.

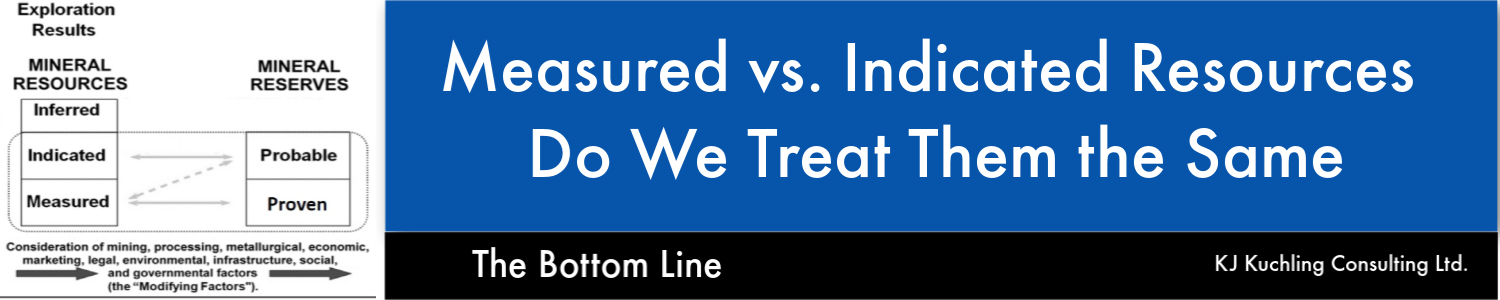
Are Measured resources important?

It appears to me that companies are more interested in what resource tonnage meets the M+I threshold but are not as concerned about the tonnage split between Measured and Indicated.  It seems that M+I are largely being viewed the same.  Since both Measured and Indicated resources can be used in a feasibility economic analysis, does it matter if the tonnage is 100% Measured (Proven) or 100% Indicated (Probable)?
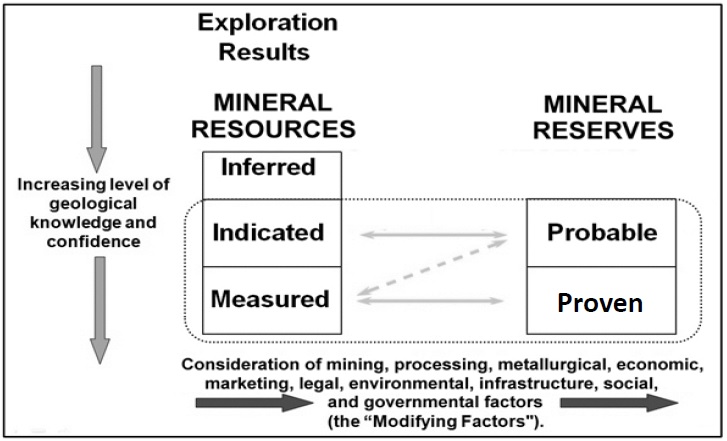
The NI 43-101 and CIM guidelines provide definitions for Measured and Indicated resources but do not specify any different treatment like they do for the Inferred resources.
CIM Resources to Mineral Reserves

Relationship between Mineral Reserves and Mineral Resources (CIM Definition Standards).

Payback Period and Measured Resource

In my past experience with feasibility studies, some people applied a  rule-of-thumb that the majority of the tonnage mined during the payback period must consist of Measure resource (i.e. Proven reserve).
The goal was to reduce project risk by ensuring the production tonnage providing the capital recovery is based on the resource with the highest certainty.
Generally I do not see this requirement used often, although I am not aware of what everyone is doing in every study.   I realize there is a cost, and possibly a significant cost, to convert Indicated resource to Measured so there may be some hesitation in this approach. Hence it seems to be simpler for everyone to view the Measured and Indicated tonnages the same way.

Conclusion

NI 43-101 specifies how the Inferred resource can and cannot be utilized.  Is it a matter of time before the regulators start specifying how Measured and Indicated resources must be used?  There is some potential merit to this idea, however adding more regulation (and cost) to an already burdened industry would not be helpful.
Perhaps in the interest of transparency, feasibility studies should add two new rows to the bottom of the production schedule. These rows would show how the annual processing tonnages are split between Proven and Probable reserves. This enables one to can get a sense of the resource risk in the early years of the project.  Given the mining software available today, it isn’t hard to provide this additional detail.
Note: If you would like to get notified when new blogs are posted, then sign up on the KJK mailing list on the website.  Otherwise I post notices on LinkedIn, so follow me at: https://www.linkedin.com/in/kenkuchling/.
Share

Claim Fees Paid for a Royalty Interest – Good Deal or Not?

mineral property acquisition
In 2016 I read several articles about how the junior mining industry must innovate to stay relevant.    Innovation and changing with the times are what is needed in this economic climate.
One company that was trying something new is Abitibi Royalties.  They were promoting a new way for them to acquire royalty interests in early stage properties.  They were offering to fund the claim fees on behalf of the property owner in return for a royalty.
Their corporate website states that they would pay, for a specified period of time, the claim fees/taxes related to existing mineral properties or related to the staking of new mineral properties.
In return, Abitibi Royalties would be granted a net smelter royalty (“NSR”) on the property.  It may be a gamble, but it’s not a high stakes gamble given the relatively low investment needed.

Not just anywhere

Abitibi were specifically targeting exploration properties near an operating mine in the Americas. They were keeping jurisdiction risk to a minimum.   Abitibi stated that their due diligence and decision-making process was fast, generally within 48 hours.  No waiting around here but likely this is possible due to the low investment required and often the lack of geological information to do actually do a due diligence on.
To give some recent examples, in a December 14, 2015 press release, Abitibi state that the intend to acquire a 2% NSR on two claims in Quebec and will pay approximately $11,700 and reimburse the claim owner approximately $13,750 in future exploration expenses. This cash will be used by the owner towards paying claim renewal fees and exploration work commitments due in 2016.   Upon completion of the transaction, these will be the ninth and tenth royalties acquired through the Abitibi Royalty Search.  For comparison, some of their other royalty acquisitions cost were in the range of $5,000 to $10,000 each (per year I assume).   I think that those NSR interests are being acquired quite cheaply.
The benefit to the property owner may be twofold; they may have no other funding options available and they are building a relationship with a group that will have an interest in helping the project move forward.  The downside is that they have now encumbered that property with a NSR royalty going forward.
The benefit to Abitibi Royalties is that they have acquired an early stage NSR royalty quite cheaply although there will be significant uncertainty about ever seeing any royalty payments from the project.   Abitibi may also have to continue to make ongoing payments to ensure the claims remain in good standing with the owner.
It’s good to see some degree of innovation at work here, although the method of promotion for the concept may be more innovative than the concept itself. Unfortunately these Abitibi cash injections investments are not enough to pay for much actual exploration on the property and this is where the further innovation is required, whether through crowd funding, private equity, or some other means.   I’m curious to see if other companies will follow the Abitibi royalty model but extend it to foreign and more risky properties.
Note: You can sign up for the KJK mailing list to get notified when new blogs are posted.
Share

Mining Cashflow Sensitivity Analyses – Be Careful

cashflow sensitivity
One of the requirements of NI 43-101 for Item 22 Economic Analysis is “sensitivity or other analysis using variants in commodity price, grade, capital and operating costs, or other significant parameters, as appropriate, and discuss the impact of the results.”
The typical result of this 43-101 requirement is the graph seen below (“a spider graph”, which is easily generated from a cashflow model.  Simply change a few numbers in the Excel file and then you get the new economics.  The standard conclusions derived from this chart are that metal price has the greatest impact on project economics followed by the operating cost.   Those are probably accurate conclusions, but is the chart is not telling the true story.
DCF Sensitivity GraphI have created this same spider graph in multiple economic studies so I understand the limitations with it.   The main assumption is that all of the sensitivity economics are based on the exact same mineral reserve and production schedule.
That assumption may be applicable when applying a variable capital cost but is not applicable when applying varying metal prices and operating costs.
Does anyone really think that, in the example shown, the NPV is $120M with a 20% decrease in metal price or 20% increase in operating cost?   This project is still economic with a positive NPV.
In my view, a project could potentially be uneconomic with such a significant decrease in metal price but that is not reflected by the sensitivity analysis.  Reducing the metal price would result in a change to the cutoff grade.  This changes the waste-to-ore ratio within the same pit.  So assuming the same size mineral reserve is not correct in this scenario.
Changes in economic parameters would impact the original pit optimization used to define the pit upon which everything is based.
A smaller pit size results in a smaller ore tonnage, which may justify a smaller fleet and smaller processing plant, which would have higher operating costs and lower capital costs.
A smaller mineral reserve would produce a different production schedule and shorter mine life.  It can  get quite complex to examine it properly.
Hence the shortcut is to simply change inputs to the cashflow model and generate outputs that are questionable but meet the 43-101 requirements.
The sensitivity information is not just nice to have.   Every mining project has some flaws, which can be major or minor. Management understandably have a difficult task in making go/no-go decisions. Financial institutions have similar dilemmas when deciding on whether or not to finance a project.   You can read that blog post at this link “Flawed Mining Projects – No Such Thing as Perfection
So if the spider chart isnt he best way to tackle the risk issue, what way is better?  In another blog post I discuss an different approach using the probabilistic risk evaluation (Monte Carlo).  Its isn’t new but now well adopted yet by the mining industry.  You can learn more at “Mining Financial Modeling – Make it Better!
Note: If you would like to get notified when new blogs are posted, then sign up on the KJK mailing list on the website.   
Share

Financings – It Helps to Have a Credible Path Forward

mine economics
Update: This blog was initially written in May 2015, however not much as changed to the end of 2018.
Let me say the obvious; the state of the junior mining market is not great these days.  The number of financings is down and it seems there are a lot of companies struggling to get their piece of the financing pie.   People mention to me that there actually is a fair bit of private equity funding available but only for the right projects.
I have heard from geologist colleagues that financing grass-roots exploration is still extremely difficult.  That is unless company management has had past successes or is well connected to the money scene.
I’m told that 43-101 resource estimates alone no longer generate much excitement.  For projects to be “on the radar” they need to be advanced to at least the PEA stage.  It seems that investors want some vision of what the project might eventually look like.
I have be made aware of more junior mining companies that are struggling for cash while others seemed to have no problem in getting at least some funding to continue their operations.  To me, the biggest differences between these two situations are;
  • If there is top notch management in place,
  • The type of project they had,
  • If their path forward and development plan made sense.

You don’t want to always change management

Management is what it is.  Companies attempt to bring on experienced people to the executive level or to the Board level.   Experienced management can hopefully establish if their project will have a high probability of success or if the project is going to be a hard sell.  This will provide guidance on whether to continue spending money on the project or look for a new project.
From my experience in undertaking due diligence, when a company is looking for financing it is important that  management have the capability to present an orderly, practical, and realistic path forward.  It is important to demonstrate where they will spend the money.
I have participated in due diligence meetings listening to management teams explain that they will have a resource estimate this year and be in production in two years.  Those around the table glance at one another, knowing that they will be lucky to have a feasibility study completed by that time and even more lucky to have their environmental permits in place.   This makes investors nervous.

Keep plans realistic and achievable

It does not help the perception of a management team (or the project itself) if the path forward is unrealistic and unattainable.  The exception being if the management team have done it before.   Similarly low-balling cost estimates and presenting great NPV’s will usually fool no one that has experience. It ultimately may do more harm to credibility than good.
The bottom line is that in order for a project (and the management team) to get serious attention from potential investors is to make sure there is a realistic view of the project itself and have a realistic path forward.
Even a good property can be tarnished by making the technical aspects look over-promotional rather than real.  Make sure the right technical people are involved in the entire process and that company management are listening to them.
Note: If you would like to get notified when new blogs are posted, then sign up on the KJK mailing list on the website.  Otherwise I post notices on LinkedIn, so follow me at: https://www.linkedin.com/in/kenkuchling/.
Share

Mining PEA’s – Is it Worth Agonizing Over Details

Mining PEA
As stated in a previous article (“PEA’s – Not All PEA’s Are Created Equal“) different PEA’s will consist of different levels of detail.  This is driven by the amount of technical data available and used in the study.    The same issue applies to a single PEA whereby different chapters of the same study can be based on different degrees of data quality.
I have seen PEA’s where some of the chapters were fairly high level based on limited data, while other parts of the same study went into great depth and detail. This may not be necessary nor wise.

Think about the level of detail justifiable

If the resource is largely inferred ore, then the mine production plan will have an inherent degree of uncertainty in  it.  So there is not a lot of justification for other engineers (for example) to prepare detailed tailings designs  associated with that mine plan.
Similarly there is little value in developing a very detailed operating cost model or cashflow model for a study that has many underlying key uncertainties.  Such technical exercises may be a waste of time and money, adding to the study duration, increasing engineering costs, and giving the unintended impression that the study is more accurate than it really is.
Different levels of detail in the same study can crop up when diverse teams are each working independently on their own aspect of the study.   Some teams may feel they are working with highly accurate data (e.g. production tonnage) when in reality the data they were provided is somewhat speculative.
The bottom line is that it is important for the Study Manager and project Owner to ensure the entire technical team is on the same page and understands the type of information they are working with.   The technical detail in the final study should be consistent throughout.
Experienced reviewers will recognize the key data gaps in the study and hence view the entire study in that light regardless of how detailed the other sections of the report appear to be.
You can read more on the subject of uncertainty in PEA’s in another blog post at this link Mining PEA’s – Not All PEA’s Are Created Equal“.
Note: If you would like to get notified when new blogs are posted, then sign up on the KJK mailing list on the website.  Otherwise I post notices on LinkedIn, so follow me at: https://www.linkedin.com/in/kenkuchling/.
Share

Metal Equivalent Grade versus NSR for Poly-Metallics

NSR for poly-metallics
Many of the mining studies that I have worked on were deposits containing multiple recoverable metals.  For example this might be Ag-Pb-Zn mineralization or Cu-Pb-Zn-Au-Ag mineralization.    Discussions were held regarding whether to use a “metal-equivalent grade” to quantify the deposit grade or to use a Net Smelter Return (“NSR”) dollar value.
This also becomes an issue since one must decide how to apply a cut-off grade for mine planning and reporting.  It can be applied to the major metal grade only, to the equivalent grade, or to an NSR dollar value.

The NSR represents a $/tonne recovered

I have found that the geologists tend to prefer using a metal-equivalent grade approach.  This is likely due to the simpler logic and calculation required for an equivalent grade formula.  At an early stage it’s also simpler to select a reporting cutoff grade based on similar projects.
Generally I have no major concerns with the metal-equivalent approach at the resource estimate stage.   However from an engineer’s view, an equivalent grade does not provide a meaningful representation of the ore quality.
It is more difficult to relate an equivalent grade to an operating scenario that may rely on different mining or processing methods generating different final products (e.g. dore versus concentrates).  The NSR approach makes it easier to understand the actual quality of the ore.
On the downside, the NSR calculation will require more input data.  Assumptions needed relate to metallurgical recoveries, concentrate characteristics and costs, and smelter payables.  However the end result is an NSR block value that can be related directly to the site operating costs.
For example if a certain ore type has an on-site processing cost of $20/tonne and G&A cost of $5/tonne, then in order to breakeven the ore block NSR value must exceed $25/tonne.   If one decides to include mining costs and sustaining capital costs, then the NSR cutoff value would be higher.   In all cases one can directly relate the ore block value to the operating cost and use that to determine if it is ore or waste.  This is more difficult to do using equivalent grades.
Where the equivalent grade can become a problem is when one cosiders the impact of metal prices.  For example, the rock grades can be aggregated to, say, an Ag- equivalent.  However this does not mean that if the silver price goes up by 20% that the rock value also goes up by 20%.  The other metal prices may not have changed, and hence only the equivalent formula would change.   The rock value would go up, but not by 20%.

Using the NSR approach, the operating margin per block is evident.

One drawback to the NSR block value approach is that the calculation will be based on specific metal prices.  If one changes the metal prices, then one must recalculate all of the NSR block values and re-populate the model.
In some studies, I have seen higher metal prices used for resource reporting and then lower metal prices for mine planning or reserves.  In such cases, one can generate two different NSR values for each block.  One can use the same NSR cutoff value for reporting tonnages.   This two NSR approach is reasonable in my view since Resources and Reserves are different entities.

Pit Optimization

Pit optimization can also be undertaken using the block NSR values rather than ore grade values, so the application of NSR’s should not create any additional problems in this area.
For projects that involve metal concentrates, the cashflow model usually incorporates detailed net smelter return calculations, which include penalties, deductions, different transport costs, etc.  The formula used for the calculation of NSR block values can be simpler than the cashflow NSR calculation.   For example, one could try to build in penalties for arsenic content thereby lowering the NSR block value; however in actuality such ore blocks may be blended and the overall arsenic content in the concentrate may be low enough not to trigger the penalty.
Since the NSR block value is mainly used for the ore/waste cutoff, I don’t feel it is necessary to get overly detailed in its calculation.  The cashflow model should always calculate revenues from individual metals rather than using the block NSR value.
The bottom line is that from an engineering standpoint and to improve project clarity, I always prefer to use NSR values rather than equivalent grades.   Geologists may feel differently.
The cutoff grade is an important parameter in mine planning.  In another blog post I discuss whether in times of high metal prices, should the cutoff grade be lowered, raised, or kept the same.  You can read that at “Higher Metal Prices – Should We Lower the Cut-Off Grade?
Note: You can sign up for the mailing list to get notified when new blogs are posted.
Share

Mining PEA’s – Not All PEA’s Are Equal

Mining Preliminary Assessments
A Preliminary Economic Assessment (“PEA”) is defined in NI 43-101 as “…a study, other than a pre-feasibility or feasibility study, that includes an economic analysis of the potential viability of mineral resources”.  This is a fairly broad definition that provides for plenty of flexibility.  While there are generally accepted industry norms for a pre-feasibility or feasibility study, the mining PEA can have a broad scope.
Some PEA’s might be based on a large database of test work and site information while others may rely on very preliminary data and require design projections based on that data.
Some PEA’s may have production schedules consisting largely on Inferred resources while other schedules may be based on higher proportion of Indicated resource.
Some PEA’s are able to incorporate information from advanced socio-environmental work while other PEA’s may not have access to advanced information.
Therefore one should not view all PEA’s are being created equal. Perhaps that is what investors are doing it seems, in many cases ignoring the results of newly issued PEA’s.
The PEA is normally developed at a fairly early stage in the project life.  The initial PEA may then be superseded with a series of updated PEA’s as more data is acquired.  Typically one would expect to see changes in project size or scope in these updates and hopefully improved economics.  Shareholders appreciate being updated on positive growth trends.

Sequential PEA’s

The sequential PEA approach is a convenient way to continue advancement of the project without making the step to a Pre-Feasibility study or bigger step to a Feasibility study.  Maybe the project is still growing in size and a feasibility study at this stage would not be presenting the true potential, hence the updated PEA.
On the downside of the sequential PEA approach is that investors may get tired of hearing about PEA after PEA.  They may want to see a bigger advance towards a production decision.  They ask “How long can they keep studying this project?”.


There is no right or wrong as to what constitutes a PEA.

The securities commissions consider that the cautionary language an important component of the PEA Technical Report and may red-flag it if it’s not in all the right places.   However this cautionary language is generally focused on the resource.
For example the typical “The reader is cautioned that Inferred Resources are considered too speculative geologically to have the economic considerations applied to them that would enable them to be categorized as Mineral Reserves, and there is no certainty that value from such Resources will be realized either in whole or in part.
In that cautionary statement there is no mention of all the other speculative assumptions that may have been used in the study.
For example, the Inferred resource may not be that significant however the amount of metallurgical test work might be a more significant uncertainty.  The previous cautionary language doesn’t address this issue.  Therefore it is important to consider the chapters in the Report pertaining to risks and recommendations for a more complete picture of the entire report.

Conclusion

The bottom line is that when reviewing a PEA report, be aware of all the uncertainties and assumptions that have been incorporated into the study.   The report may be well founded or built on a shaky foundation.  No two PEA’s are the same and this must be clearly understood by the reviewer.
Currently it seems that share prices do not move much with the issuance of a PEA.  It seems there is a lack of confidence in them.  On the other hand, I have also heard that it is better for future financings if a project has at least reached the PEA stage.
Develop your own personal PEA “checklist” to identify the amount and quality of data used for the different parts of the study to help understand where data gaps may exist.
In another blog post I discuss how it is important for the Study Manager and project Owner to ensure the entire technical team is on the same page and understands the type of information they are working with.   The technical detail in the final study should be consistent throughout.   You can read that blog at “PEA’s – Is it Worth Agonizing Over Details“.
Note: If you would like to get notified when new blogs are posted, then sign up on the KJK mailing list on the website.  Otherwise I post notices on LinkedIn, so follow me at: https://www.linkedin.com/in/kenkuchling/.
Share