Articles tagged with: exploration

The Surprising Parallels Between Junior Miners and Tech Startups

Recently I’ve seen a few LinkedIn conversations about whether the mining industry is spending enough money on Research and Development (R&D). Usually when one thinks of R&D, one might envision the development of new technology, new drug, equipment or software.
I would suggest that mineral exploration should be viewed through the R&D lens. Exploration (or acquisition of explorers) is the most significant way that the industry can self-manage to grow revenues. If exploration is R&D, that then leads to the observation that Junior Miners are the precursors for today’s Silicon Valley startups.
Before venture capital and “startup culture” became a phenomenon, junior mining companies were already operating on the startup core principles. Small, capital driven explorcos were based on unproven assets, led by specialized technical teams. They were funded by investors accepting risk in the hopes for 10 bagger or 100 bagger upsides. This is effectively the same business model that Silicon Valley would build upon.
This blog post examines whether the junior mining industry was a leader in Tech Startup culture. Even things like the Lassonde Curve and the PEA have their comparables in the current tech world.

Are Junior Miners precursors to Tech Startups

Junior mining companies and Tech Startups share numerous similarities, although they operate in very different worlds. The following comments should recognize that junior mining ecosystem has been around for generations, long before the birth of tech ecosystems.
Junior mining companies and Tech Startups are both high-risk, high-reward ventures. Junior Miners and Tech Startups are early-stage companies where the vast majority fail. Investors accept enormous risk in exchange for the possibility of enormous returns if a discovery or product is a resounding success. Lets look at some of the similarities.
  • A startup spends years (and millions of dollars) building an MVP (Minimum Viable Product). If the market doesn’t want it or the tech fails to scale, the company goes to zero. Similarly if holes don’t hit or the metallurgy is too complex, the mining asset can face significant headwinds.
  • Both mining and tech are essentially “concept” or “pre-revenue” gambles. A Junior Miner typically has no producing mine, just exploration assets and the dream of an economic mineral deposit. Similarly, many Tech Startups have no revenue, just a product idea or some early traction. Investors in both cases are betting on the team and its future value, not on the non-existing cash flow.
  • Both burn through cash (lots of it) before generating revenue. Mining juniors need constant financing rounds (placements) to fund exploration; startups need financing rounds for R&D and growth. Neither can easily self-fund, although bootstrapping is more common in tech than in mining. Both may rely on exit strategies consisting of acquisition from larger industry players.
  • Both generate proprietary data. A Junior Miner’s most valuable asset is often its geological data (drill results, resource estimates, land tenure). A Tech Startup’s asset is its IP, code, or trade secrets. In both cases, the assets are largely intangible until proven economic.
  • Both rely on quality founders and management. A small, skilled team can make or break the company. A geologist or executive with a great track record (“the Midas touch”) is analogous to a serial tech founder. Often the investors are backing the person more than the project.
  • Both sectors are heavily sentiment-driven (mining likes 2025, tech not so much). A hot commodity cycle floods junior mining with capital. A hot tech cycle (AI, crypto, SaaS) floods startups. When investor sentiment reverses, funding dries up fast and many companies are left to die, possibly to rise again in the next cycle.
  • Both sectors can follow the “Lassonde Curve” (mining) or the “Hype Cycle” (tech). There is an initial surge of excitement during discovery/launch, followed by a “boring” period of technical de-risking (development/user acquisition), and finally a re-rating once they reach production or profitability. (More on the Lassonde Curve later in this blog post).
  • Both sectors require pitching their story to investors. The Tech Startups rely on pitching to angel investor via shows like Shark Tank, pitch summits (t) using 5 minute elevator pitches (“get to the point” pitches). The Junior Miners rely on the numerous mining conferences like PDAC, Mines & Money, Beaver Creek, Zurich, again relying on the PowerPoint pitch to gather eyeballs.
Obviously we should also point out there some differences between juniors and Tech Startups.
  • Juniors work with physical geological reality. You either find the ore body or you don’t. Startups can pivot; geology can’t.
  • Mining has far longer timelines; discovery to production can take 10–20 years vs. a startup’s typical 5–7 year VC cycle. Any longer than that, and a Tech Startups technology can become obsolete.
  • Regulatory, environmental permitting, and social license is a constraint for miners with no real startup equivalent. Viable exploration projects can get blocked through no fault of the miner itself.
  • Junior Miners are more commodity-price dependent. Even a great deposit can be uneconomic at the wrong metal price. Conversely a miner’s asset could become more valuable over time based on metal prices. Tech startup do not rely on a commodity price outside their control.
  • Junior Miners tend to rely on public capital markets for financing right from the start, although the trend toward private equity mining investment may be increasing. Conversely, at early stages, Tech Startups tend to be bootstrapped and financed via private equity, venture capital, and angel investors. Junior Miner investments can provide more liquidity and exit opportunities due to their public listing. Tech investors may be locked in until a liquidity event occurs.
  • The startup world will label their financing rounds (seed, Series A, Series B,..) with the hope that future investors provide financing at higher valuations than earlier investors.   The mining industry does not label their placement rounds – perhaps they should.
In conclusion, an analogy between Junior Miners and Tech Startups can help outsiders understand the risk, capital structure, and investor behavior of both industries. One might conclude that Junior Miners were the Tech Startups of decades prior, and are still functioning that way today.

Should exploration expenses be considered R&D

Exploration spending shares some of the same characteristics of more commonly R&D.
R&D is uncertain in outcome, generates intellectual property (geological data, resource models), and is expensed before any revenue is realized. A pharma company doesn’t know if a new drug will be a win, similarly a Junior Miner doesn’t know if a drill program will yield an economic deposit. Both activities are investments in discovering something of future value, hopefully.
R&D is about de-risking a concept, and de-risking is a term commonly used by Junior Miners. Every drill hole, soil sample, and geophysical survey is a data point that builds knowledge, and even uneconomic drill holes provide value by focusing the search area.
Much like our drug development example, exploration has a high-failure, high-reward path. Early-stage “lab work” (geochemistry/geophysics) leads to “clinical trials” (core drilling) and eventually “commercialization” (feasibility and production).
There are also some differences between exploration and conventional R&D. R&D will typically create proprietary intellectual property, like a new drug or software platform that can be replicated and marketed globally. A mineral discovery is a unique, non-replicable physical asset in a given location. R&D in tech is about creating something from nothing (innovation), while exploration is about finding something that already exists (discovery).
Exploration also tends to be more binary since it is geologically constrained. You either find an ore body or you don’t. You can’t modify or pivot with an orebody. On the other hand, drug and software R&D can yield partial successes or new technologies, that may have other applications.
Although there are both similarities and differences, the analogy is interesting. Exploration may be considered as a hybrid since it has the uncertainty and knowledge-creation aspect of R&D, but the result is a unique physical asset and not IP. In my view exploration is equivalent to R&D.

Lassonde Curve vs Hype Cycle Curve

As mentioned previously, junior mining and Tech Startups will follow a cyclic path of hype and despair. In mining it is known as the “Lassonde Curve” and in tech its called the “Gartner Hype Cycle”. Let’s look at the similarities. Which came first?
The Lassonde Curve is the “elder” of the two models, predating the Gartner Hype Cycle by about a decade. I had written a previous blog post on this at Mining’s Lassonde Curve – A Wild Ride.
The image below shows them side by side, and they do look similar. While both charts effectively track the “rollercoaster” of investor psychology and technical de-risking, they emerged from different eras and industries. Both charts have a x-axis that represents time and both have a y-axis that represents expectation ( stock price can be viewed as a measure of expectation).

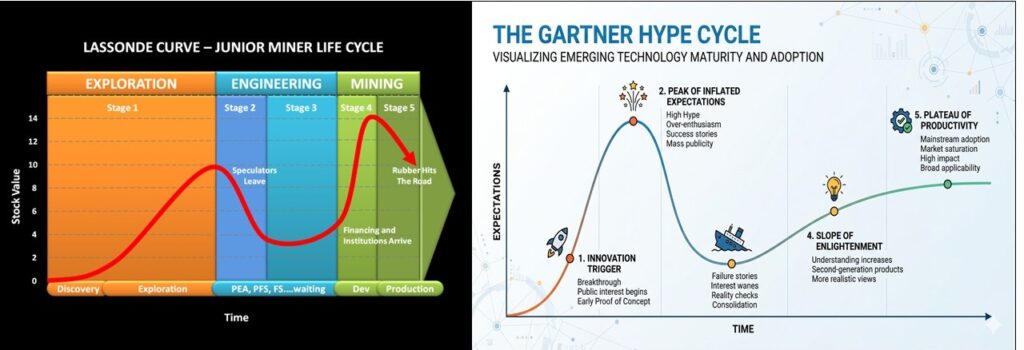
1. The Lassonde Curve (developed in late 1980s)
Created by Pierre Lassonde, the legendary mining financier and co-founder of Franco-Nevada. The model explains the life cycle of junior mining stocks to investors, explaining why sometimes investors get burned after a discovery even if the project is technically sound.
2. The Gartner Hype Cycle (developed in 1995)
Created by analyst Jackie Fenn at the technology research firm Gartner to help clients distinguish between the “hype” of a new technology and its actual commercial maturity. The model guides corporate IT departments on when to invest in new technologies (e.g., AI, Cloud, VR) without getting burned by the “Peak of Inflated Expectations.”
Does the Gartner HC model use the earlier Lassonde Model as a template? Both models show that humans tend to over-speculate on “newness” (whether it’s a drill hole hit or a new technology) and then lose interest when the hard work begins. It seems that Pierre Lassonde mapped that human behavior a few years before the tech world did. In this aspect, the understanding of investor behavior in junior mining was leading the way for Tech Startup behavior.


Is a PEA Study Like a Tech Product Market Fit (PMF) Study

Another similarity between junior mining and tech world is in the way early-stage viability is assessed. This is required to decide whether millions of dollars of further investment is warranted. Miners will complete a PEA. Startups will complete Product-Market Fit research.
A Preliminary Economic Assessment (PEA or scoping study) is an early-stage technical and economic evaluation of a mineral deposit. Its core purpose is to determine whether a project is potentially viable before committing significant capital to more advanced studies.
Product-Market Fit (PMF) research for a Tech Startup is a structured effort to determine whether a product satisfies a strong market demand. The goal isn’t just to confirm PMF exists; its to understand the who, why, and how it will work before committing to aggressive growth.
Comparing a Preliminary Economic Assessment (PEA) to a Tech Startup’s Product-Market Fit (PMF) stage is a great way to see how both industries similarly “de-risk” an idea before committing big money.
In both worlds, this is the moment where one stops saying “We have a cool idea or a nice deposit” and start saying “We have a viable business.”
1. The “Does This Thing Actually Work?” Test
– Tech (PMF): Once the team has built a beta, they can see if people are using it and are willing to pay for it. They need to prove there is a market for the tech.
– Mining (PEA): The team has found a deposit. The PEA is the first time they can put a dollar sign on it. It’s a conceptual study that predicts “If we build a mine here with these current economic inputs, it should make money.”
2. The Shift from “Geology” to “Economics”
Just as a Tech Startup shifts from coding to customer acquisition cost (CAC), a Junior Miner shifts from geology to metallurgy and CAPEX.
– Tech: It doesn’t matter how good the code is, if it costs >$50 to acquire a customer who only spends $5 it will not be a viable venture.
– Mining: It doesn’t matter if you have 2 million ounces of gold if the rock is difficult to process or if the project costs billions to build. The PEA is the first reality check on these costs.
3. Attracting the Investors
The PEA / PMF stage may be the ultimate gatekeeper for many institutional capitalists.
– Tech: Once you deliver a PMF, Venture Capital (VC) firms may be more willing to provide growth capital to scale the business.
– Mining: Once a positive PEA is released, the company may see a “re-rating.” Larger funds and mid-tier miners may start looking at the project as a real asset rather than just a speculation.
In closing, It is important to remember that both PEA / PMF stages are still early. A tech company with PMF can still be crushed by a competitor or a change in regulatory or platform privacy requirements. A mining project with a PEA can still fail if the Pre-Feasibility Study (PFS) reveals that the environmental permitting or economic factors are not as expected. Neither early stage study is a guarantee for future success, which is another similarity between the two sectors.

Conclusions

There are many parallels between Junior Miners and Tech Startups. The similarities are in how they are built, how they function, and how they acquire funding.
In that way, exploration expenditures can also be viewed through the lens of R&D spending. So it may be improper for some to suggest that the mining industry is not spending enough on R&D, when it actually is spending huge amounts on R&D.
The Junior Mining industry has been around much longer than the Tech Startup world, and hence have led the way in building an ecosystem for speculative investment.
Is it cool to work in the startup world? The answer is yes if its tech, and (unfortunately) no if its mining.


You can sign up for the KJK mailing list to get notified when new blogs are posted. Follow me on Twitter at @KJKLtd for updates and other mining posts. The entire blog post library can be found at https://kuchling.com/library/
Share

Beyond the Headline Grade: For or Against Assay Transparency?

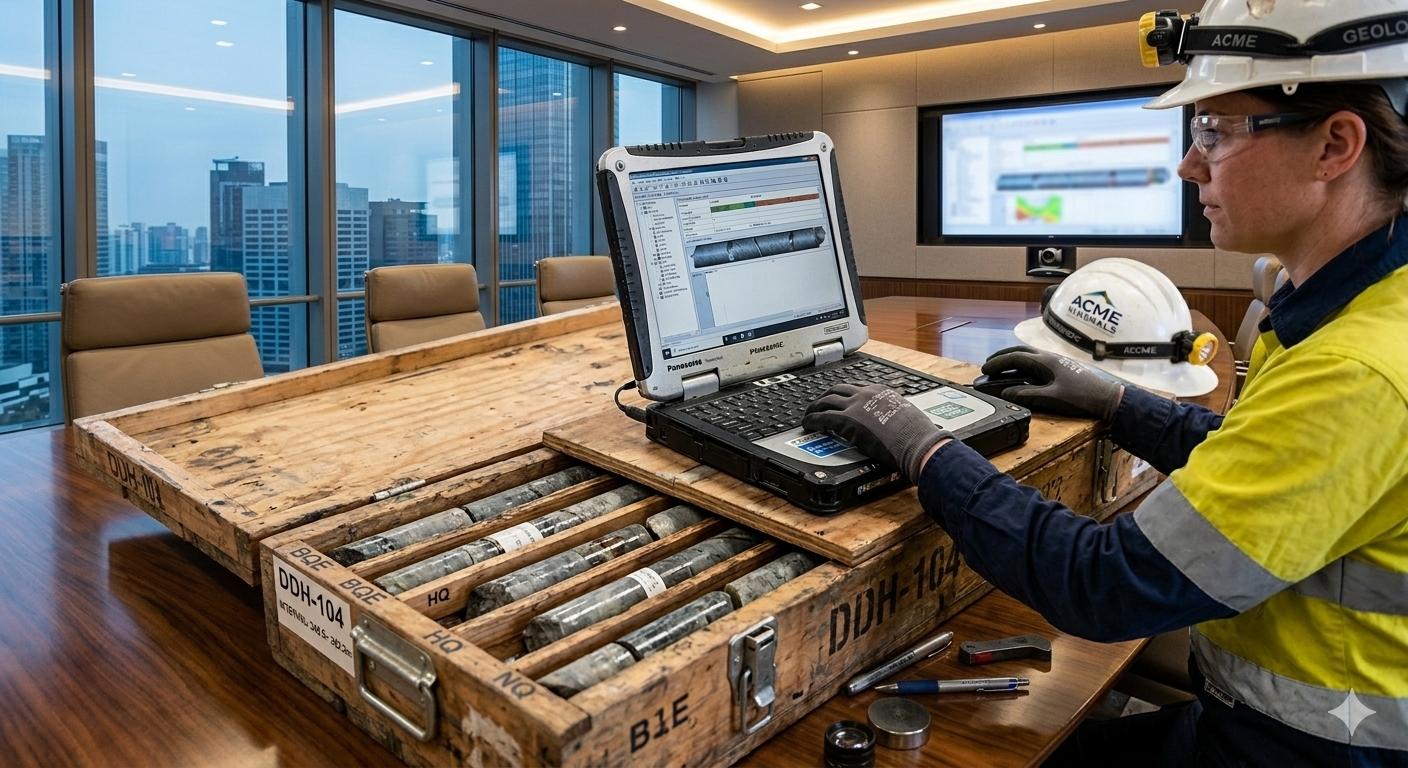
Recently I have been reviewing a few mining projects from an investor’s perspective. This led me to wonder whether junior mining companies should share more than just their drill hole highlights. What about the raw assays? A mining company announces highlighted drill intervals, but what exactly do those numbers represent?
The highlighted drill interval is based on a series of individual assay samples. The selection of the interval “From” and “To” and “Including” is made by the company using their own criteria. They may include low-grade sections (i.e. smoothing), apply variable cutoffs, sometimes use metal equivalent grades or NSR value to defines the ore/waste cutoff.
The interval definition process is largely invisible to investors, yet for early-stage projects, drill hole intervals are the primary driver of investor communications and their own project valuation.
The underlying basis for drill intervals are raw assay data. These assays can be complex, messy, technical, and may require expertise to interpret properly. However examining the individual assay data can tell more of the story than looking at intervals alone. For example, assays will demonstrate the grade continuity, any nugget effects, or whether thin high-grade spikes are boosting average grades.
This raises the question of whether companies should routinely publish, in CSV format, for download BOTH interval data and raw assay data.
This blog post discusses the pros and cons of releasing assay data electronically.

Why Might an Investor Want the CSV Data

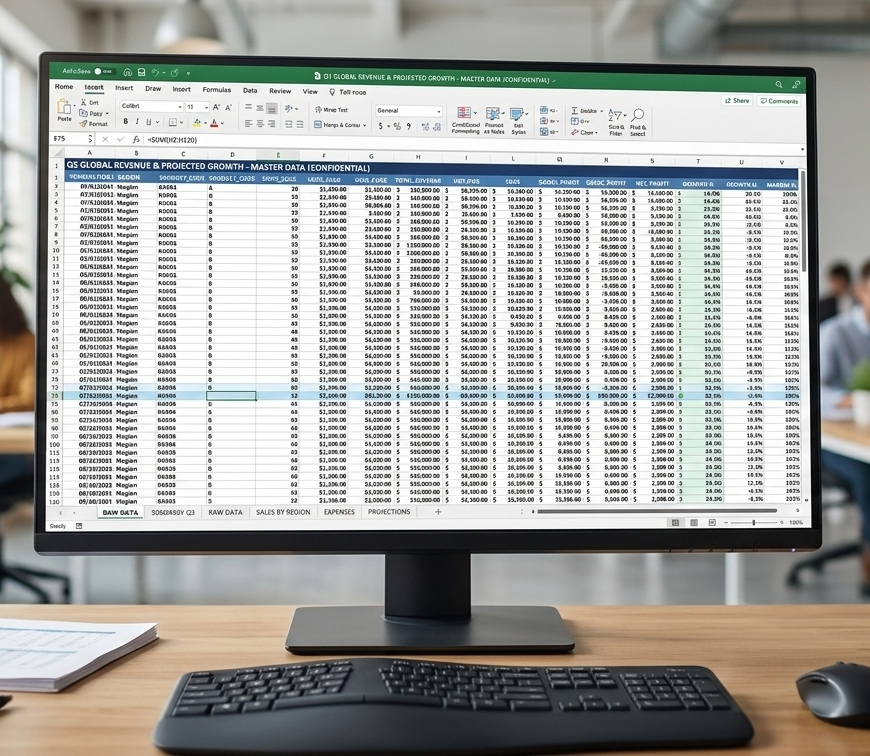
There is a sense that many mining investors are becoming more sophisticated, and they want to fully understand the exploration process.
Some investors have geological software with which to examine the exploration data in 3D. Other investors may simply rely on Excel to run their own statistics. Investors may wish to verify what a company is doing, as well as examine their own concept for a project.
Investors might be questioning whether:
  • Companies change the nature of a deposit by smoothing narrow high grade intervals over wider intervals to give the impression of a large tonnage bulk deposit;
  • Companies are using by-product metals in their metal-equivalent, which investors have less confidence in. Perhaps they would prefer to examine the deposit based solely on their primary metals of interest. Perhaps investors prefer to understand the NSR Rock Value ($/t) instead of relying metal-equivalent grades.
  • Companies have not provided sufficient geological cross-sections or 3D images, and investors wish to create their own.
To examine any of these issues, one must have the exploration data in electronic format. For large players, signing an NDA (Non-Disclosure Agreement) and entering the corporate data room provides preferential access to this information. Small players may not be able to do this and some may consider this unfair and selective disclosure.

Highlighted Interval Data in CSV Format

Companies will disclose all highlighted drill INTERVALS in news releases, usually in table format (see example image). If someone wishes to analyze all the interval data on a project, it can be a tedious process to gather all the new releases PDF’s. The tabular data can then be scraped using Ai or one can use Excel “Get Data” functionality on a table by table basis.
This work can be cumbersome and sometimes data does not transform cleanly, often with missing rows, columns, or misaligned data.
Why make investors jump though those hoops to summarize data that’s already been disclosed? Hence, I would suggest companies maintain downloadable historical drill interval data in CSV format on their websites, in a format as presented in the news releases.
Raw assay data, however, is a different matter than interval data since assays have not been made public in the news releases. This is discussed in the next section.

Raw Assay Data in CSV Format

Deciding whether to release raw drill hole assay data is a balance between transparency and strategic risk. The only companies that are doing this (that I am aware of) is Power Metallic and (previously) Great Bear Resources. There may be more that i am not privy to.
There are both pros and cons to making the raw assay data available. Note that raw assay data files typically will also include drill hole collar coordinates and downhole survey information, the whole package.

The Pro’s and Benefits of Raw Data Disclosure

1. Market Credibility: A company being “radically transparent” can set them apart by signaling to the market confidence in their data and they have nothing to hide. This can build trust with those who want to verify the discovery. This can differentiate one from peers in a crowded junior market where transparency may be lacking.
2. Free Technical Analysis: Raw data appeals to technically sophisticated investors, geologists, and analysts who want to do their own review. The independent “super-investors” who run their own models may reach the same conclusions as the company, proving external validation for the project. They may essentially help IR with free marketing and 3rd party promotion. Of course, the opposite can also happen if the project is not as robust as being promoted by the company.
3. Speed: Raw data access may speed up due diligence for potential acquirers or JV partners who can initiate confidential internal reviews prior to deciding whether to enter a formal NDA and due diligence process.

The Con’s and Risks of Raw Data Disclosure

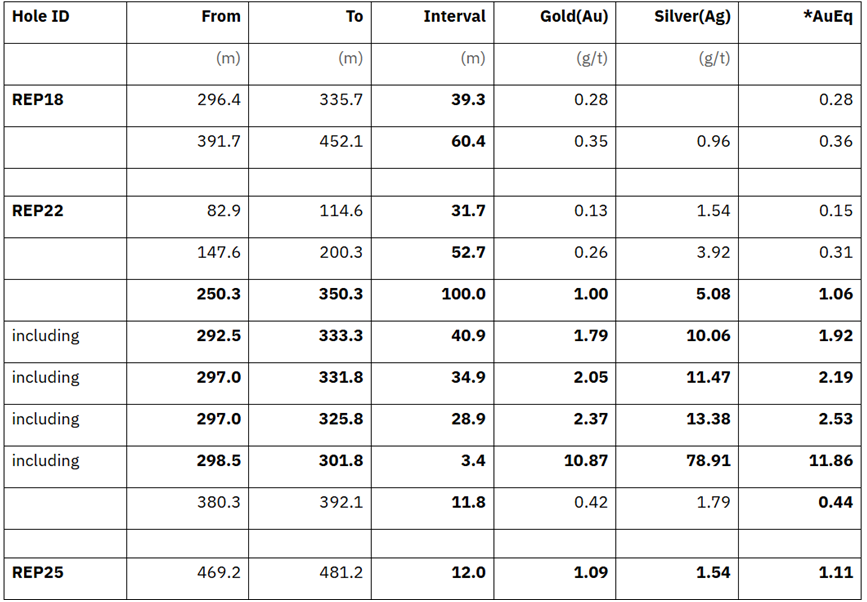
1. Misinterpretation & “Amateur” Experts: One risk is that someone with a very basic understanding of mining software and limited understanding of the local geology, runs flawed interpretations and publicizes their incorrect conclusions. A company may find that correcting false narratives publicly can be harder than preventing them.
Conversely stock pumpers can cherry-pick individual high-grade intervals out of context and also create misleading narratives (albeit positive) outside of the company control.  They may have their own motives to pump the stock.
2. Competitive Intelligence: If in a competitive exploration district, neighbors can use raw assay values and lithology codes to predict where the mineralization is trending. This could help them acquire adjacent mineral claims before one can fully consolidate the regional land package. Regardless, competitors may still be able to do some of this using the drill hole interval data from news releases, so this may not be a big risk.
3. Liability and Compliance: NI 43-101 reporting requires technical data to be verified by a Qualified Person (QP). If one provides a raw assay file that isn’t properly vetted or contains errors, will there be regulatory or legal issues?  Normally a corporate QP signs off on news releases, not necessarily an independent QP.
There have also been cases where assay data has been purposely manipulated from lab certificates to the drill hole database, and investors would then be working with this falsified data. Corporate liability could be a big risk in the eyes of some.

The Assay Disclosure Middle Ground

Once the assay data is public, it may be more difficult for a company to manage the story. A press release lets them frame results in the context of their business plan; a raw data file does not.
Instead of providing a full assay database download, some companies might follow the approach below. It may not satisfy everyone, but could be better than just ignoring requests for more detailed information.
  • Interactive Map: Use a web-based GIS tool that allows users to click holes and see downhole results graphically without downloading the full database.
  • Cross-Sections: Provide multiple high-quality cross-sections that show the geological interpretation alongside the raw assay grades or use a grade bar chart along the drill hole trace. This provides information on the grade continuity and uniformity without releasing the actual grades.
  • Post-resource estimate disclosure: Once the database has been formally audited by an independent QP and incorporated into a 43-101 technical report for a resource estimate, releasing the assay data may be lower risk.
These actions may give a sense of greater transparency while keeping the raw data within a controlled environment. It will help prevent amateurs from erroneous modeling the geology yet still “somewhat” satisfying the sophisticated mining investor.

Conclusion

For investors trying to assess a junior explorer, or geologists conducting a technical review, or a regulator trying to ensure fair and accurate disclosure, access to raw assay data can play a part in promoting good judgment and accurate disclosure from companies.
However some suggest that raw data without context is subject to misinterpretation.
Personally, I would prefer to see the release of both drill intervals and raw assay tables in CSV format.
In this modern area of Ai and investor sophistication, greater data transparency may be a positive and help build more trust in the industry. However, I understand the reasons not to do this and understand if companies choose to not go this route.
Currently the mining industry norm is that raw assays stay in private data rooms and not on corporate websites. Credibility tries to be achieved via clear, technically detailed news releases and Technical Reports.


You can sign up for the KJK mailing list to get notified when new blogs are posted. Follow me on Twitter at @KJKLtd for updates and other mining posts. The entire blog post library can be found at https://kuchling.com/library/

APPENDIX: EXCEL TASKS

I asked an Ai colleague Claude to list all the things one could do in Excel with publicly released drill hole information. Here is what it said (unedited). Its never lacking in advice and Claude will even help you create the Excel worksheet logic if needed.
Grade Analysis
  • Descriptive statistics – mean, median, mode, min/max, standard deviation of assay values (Au, Ag, Cu, etc.)
    Grade frequency distributions — histogram charts to understand grade population shape.
  • High-grade outlier identification — flagging values above a threshold (e.g., >3x median) that may need capping consideration.
  • Grade capping/cutting analysis — testing different cap values and their effect on average grade.
  • Coefficient of Variation (CV) — assessing grade variability and nugget effect risk.
Composite & Interval Analysis
  • Downhole compositing — averaging assay intervals into fixed-length composites (e.g., 2m or 5m) using weighted averages.
  • True width estimation — applying trigonometric corrections for hole dip/azimuth vs. vein orientation.
    Grade x thickness (GT) calculations — multiplying average grade by intercept width for comparative ranking of intersections.
  • Cut-off grade sensitivity — running intercept calculations at multiple cut-off grades to see how reported widths and grades change.
Hole Correlation & Comparison
  • Hole-by-hole grade comparison — ranking holes by peak grade, average grade, or GT value.
  • Section-by-section comparison— grouping holes by fence/section for along-strike trend analysis.
  • Depth vs. grade plots — scatter plots to look for grade zonation with depth.
  • Multi-element ratio analysis— e.g., Au:Ag ratios, Cu:Mo ratios to identify metallogenic zonation or alteration trends.
Spatial & Trend Analysis
  • Collar location plotting — basic X/Y scatter plots of collar coordinates to visualize drill pattern coverage.
  • Downhole survey data — using dip/azimuth measurements to approximate downhole trace (basic desurveying).
  • Strike and dip trend identification — plotting grade against easting or northing to identify directional trends.
  • Variogram-lite analysis — plotting grade vs. distance between holes to get a rough sense of spatial continuity (proper variography needs dedicated software).
Multi-Element & Geochemical Analysis
  • Correlation matrices — identifying which elements are positively or negatively correlated (e.g., Au vs. As in a Carlin-type system).
  • Scatter plots — visualizing element-pair relationships to identify pathfinder associations.
  • Log-transformation — applying LOG10 to skewed assay data before statistical analysis, which is standard practice.
  • Anomaly thresholding— mean + 2 standard deviations as a simple anomaly threshold for pathfinder elements.
Resource Estimation (Basic)
  • Polygonal area calculations — basic area-of-influence resource estimation using drill spacing geometry.
  • Grade tonnage curves — plotting tonnes vs. grade at varying cut-offs using simplified volume assumptions.
  • Bulk density sensitivity** — testing how different SG assumptions affect tonnage estimates.
Reporting & QA/QC
  • Duplicate analysis — comparing field duplicate, coarse reject duplicate, and pulp duplicate pairs using scatter plots and % relative difference calculations.
  • Standard performance tracking — plotting certified reference material (CRM) results against expected values and control limits (±2SD, ±3SD).
  • Blank monitoring — flagging blank samples that exceed contamination thresholds.
  • Laboratory turnaround tracking — monitoring submission dates vs. return dates.
Share

Junior Mining Shams and Scams – Part 2

This is Part 2 of the blog post discussing junior mining scams and the sanctioning of those responsible.  Part 1 can be found at this link “Junior Mining Shams and Scams – Part 1” and can be read first to get some background.
Part 2 provides examples involving professional Qualified Persons (QPs).  We may have the feeling that QP’s are never held accountable for their work, but that is not always the case.  There are numerous instances of QP’s being hauled off in front of their professional organizations for unprofessionalism.   This blog will highlight some of those cases.
The lesson is that QP’s signing off on technical information for clients should be proficient in the nature of their work and need to know the reporting rules very well.  Some of these incidents involve error and poor judgment, not outright fraud.
These examples involve in-house QP’s that work for a company while others involve independent QP’s that have been contracted by the company.
In most of these cases, any sanctions, if applied, were mainly doled out by the professional engineering or geological associations.  The legal courts are often not involved.

Examples (Part 2)

Inaccurate QP Resource Estimate:  This example relates to the Barkerville Gold Mines resource estimate complete in 2012.  The mineral resource estimate had numerous errors and issues related to assays, capping, cutoff grades, etc.   The allegation was the QP had demonstrated incompetence, unprofessional conduct, and negligence.   The sanctions on the QP included a $15,000 fine, $20,000 legal costs, re-training, and license suspension.
Link 1:   
Link 2:
False QP Statements:  Here is an example from 2011.  The QP / company Director was charged with multiple allegations, including stating the mine was in commercial production (when it wasn’t), leaving the impression there were mineral resource (which there weren’t any), and generally approving information that was not accurate.  Ultimately the allegation was demonstrating incompetence, unprofessional conduct, and negligence.   The resulting sanctions included 2 year license suspension, re-training, payment of $80,000 to the professional association.
Link 1: 
False QP Statements: This is case were a resource QP failed to comply with the NI43-101, Form 43-101F1, CIM Standards, and CIM Guidelines. The Panel concluded that the Member was guilty of non-compliance with the standards and hence guilty of professional misconduct. Its not clear what specifically was not complied with, but this illustrates that QP’s will be held accountable for their work.  The two reports in question were either amended or withdrawn to address the concerns of the regulator in British Columbia, although there had been no intentional non-compliance and no economic impact.   The penalty was 2 months suspension (deferred), and the QP had to work under a mentor for 9 months and pay a maximum $10,000 for the mentor’s fees.
Link 1: 
False QP Statements:  Here is another example of sanctioning a QP in 2018.  The person was charged with unprofessional conduct and incompetence.  He stated that he was responsible for the preparation of the technical report, had no prior involvement in the project, and was independent of the issuer.  This was false.   Sanctions included three month license suspension, taking some re-training, require peer review of the report.   In 2022, further sanctions consisted of a $75,000 penalty, further sanctioned along with an executive in the company for insider trading issues (see Link 3 below).
Link 1:
Link 2: 
Link 3:
False QP Statements:  This is an example for 2017 when an independent QP took responsibility for the resource estimation work in section 14 of the report, yet they did not have the experience to take responsibility.   They also misrepresented that the Report complied with 2014 CIM standards, yet it didn’t, resulting in an overestimation of the mineral resource in both confidence and magnitude.    Other claims include relying on non-QP experts but not stating that, failing to adequately discuss the nature of sample quality control procedures as required.    The sanctions included license suspension of 3 months, must work with a technical supervisor, re-training, and $7,500 in legal fees.
Link 1:
False QP Statements:  This is another example from 2019, when the QP / Director permitted the disclosure of information to the public in multiple news releases where they should have known that that information was misleading.  An example is the disclosure of inferred reserves when there were no reserves and “inferred” is not even a classification of reserves.   The sanctions were a license suspension of 4 months, $5,000 legal costs, re-training, and requirement not to act as a QP again.
Link 1: 
QP Resource Estimate Error:  This occurred in 2012 when a QP and consulting firm delivered a incorrect resource estimate and reportedly withheld negative opinions on the project from the client.  The company spent $3 million on a feasibility study during which the resource estimate error was discovered.  The “corrected” resource made the project uneconomic, meaning the feasibility study should not have been done.  The mining company sought compensation from the consulting firm, ultimately receiving $1.25 million.  The Link 3 references is interesting in that it states “As this case demonstrates, it is critically important for professional service firms to be forthcoming about any reservations they may have regarding the work they are being employed to undertake.”     Whatever  that really means?
Link 1: 
Link 2:
Link 3: 

Disclaimers

Many QP’s realize the legal responsibility and liability they have.  Hence in 43-101 reports QP’s sometimes attempt to mitigate this by putting in broad disclaimers to limited that liability.  If the securities commission notices such disclaimers, they will require that they be removed.
For example, sometimes the QP of a chapter may have other geologists or engineers (i.e. experts) assisting them.  They may then put in disclaimers saying “They disclaim responsibility for such expert content” for the work done by the others.   A QP essentially has to sign off on the work of others in the sections they are responsible for.   A recent example is a Generation Mining technical report prepared by G-Mining, that had to be amended from (March 31_2023 to May 31_2024) removing several QP liability limiting disclaimers.
43-101 regulations state that “An issuer must not file a technical report that contains a disclaimer by any qualified person responsible for preparing or supervising the preparation of all or part of the report that
(a) disclaims responsibility for, or limits reliance by another party on, any information in the part of the report the qualified person prepared or supervised the preparation of;
or (b) limits the use or publication of the report in a manner that interferes with the issuer’s obligation to reproduce the report by filing it on SEDAR.
These disclaimers are also potentially misleading disclosure because, in certain circumstances, securities legislation provides investors with a statutory right of action against a qualified person for a misrepresentation in disclosure that is based upon the qualified person’s technical report.
That right of action exists despite any disclaimer to the contrary that appears in the technical report. The securities regulatory authorities will generally require the issuer to have its qualified person remove any blanket disclaimers in a technical report that the issuer uses to support its public offering document.

Conclusion

This ends Part 2 of this blog post. It hopefully highlights the importance of QP’s being knowledgably on the disclosure rules and the technical aspects of what they are hired to do.
Companies should always ensure that only qualified QP’s are used for their project work, even if some of the others might be less expensive.   The potential headaches and costs afterwards may override the higher upfront cost.
It should be noted that this Sham and Scam blog does not discuss the other less than desirable junior mining traits seen from time to time.  These relate to; insider trading; abuse of micro-penny founder shares; and the ever present “pump & dump” schemes.
In closing, if anyone is aware of other good examples of QP issues, please provide any links to any publicly disclosed information. I can add them to the blog post.
Note: You can sign up for the KJK mailing list to get notified when new blogs are posted. Follow me on Twitter at @KJKLtd for updates and other mining posts.   The entire blog post library can be found at https://kuchling.com/library/
Share

Junior Mining Shams and Scams – Part 1

Recently (in April 2024) Red Pine Exploration issued several press releases highlighting that some assays in their geological database were found to have been manipulated. Numerous assays input into their database did not match the original lab certificates. Is this another mining scam?
The Red Pine event led me to ask some colleagues about similar situations that have occurred and whether the personnel responsible were ever sanctioned. Their feedback provided me with several past examples of such incidents, which I have attempted to summarize in this two-part blog post. Big thanks to my colleagues that took the time to provide these examples.

Raise the Red Flag

The focus of this blog is on the types of activities that raised the red flags in the past. I am less interested in naming the people responsible, although the associated web links do provide more detail on the events.
Not all of the examples listed in these two blogs are scams or deliberate falsification of results. Some may be incompetence, faulty reporting, or lack of diligence and care. Some of these involve company executives, in-house Qualified Persons (QPs), and independent QP’s working for the companies.
Part 1 has examples mainly involving company management or in-house QPs. Part 2 will provide other examples where QP’s have been held to account for their poor quality of their work.

Examples (Part 1)

The following are presented in no particular order. Some of these may still be at the allegation or investigation stage. This blog post can be updated when the issue is eventually resolved.
Tampering with Samples: Bre-X salting of samples is the number one example of a well orchestrated scam. I’m not sure if anyone was ever officially convicted of anything at Bre-X, but it warranted several books, recent podcasts, and even a loosely-based Hollywood movie (Gold).  As an aside, I had spoken with the Bre-X team in 1995 about consulting work while I was living in Calgary. However, they were still far from needing mine engineering services at that time. That would have been a wild ride, although with my luck, I would have ended up being the only one in jail.  For further information here is an interesting story from Warren Irwin on the Bre-x story. https://redcloudfs.com/25-years-after-bre-x-by-the-man-who-made-a-fortune-going-long-short-of-the-biggest-ever-mining-fraud/
Falsifying QP Signature: The B.C. Securities Commission (BCSC) is alleging that a B.C.-based mining company and its CEO made false or misleading statements about an Idaho mineral deposit in a report that it filed. In 2019, Multi-Metal filed a technical report which contained an electronic signature of a qualified person – a professional engineer – and listed him as an author. The BCSC alleges the qualified person did not review, sign, or consent to filing Multi-Metal’s report. At this time, the BCSC’s allegations have not yet been proven.
Link 1 
Falsifying Assay Data: The Ontario Securities Commission approved a settlement agreement between a geologist with 30 years of experience and the Qualified Person for Bear Lake Gold Ltd. Between 2007 and 2009 the QP altered certain assay results and transferred these results into the company’s assay database; prepared draft press releases that contained incorrect and inflated data, then provided Independent QP’s with the altered data, and also replaced core and modified a drill core log. In the settlement, the QP agreed to a permanent ban from acting as a Director and Officer of any issuer, an administrative penalty of $750,000, $50,000 in costs, and a prohibition from trading.
Link 1
Link 2
Link 3
Falsifying Assay Data: In 2024 Red Pine Exploration Inc. reported that there were 382 assay inconsistencies out of a total of 60,000 assay results for the 2019-2024 Period, representing 95 intersections contained within 69 drill holes as follows. An independent investigation is underway, however at the time of this blog, the investigation is still on-going. A link will be provided here once their final report is disclosed publicly.
Link 1
Tampering with Samples: This example goes back to 1981, involving New Cinch Uranium. They published test results that showed significant gold and silver at their New Mexico property. After the stock jumped, third party tests showed that samples did not contain any significant amount of precious metals. The New Cinch samples were “salted”. The Vancouver Stock Exchange was sued for not verifying the company’s test results. In response, the VSE made it compulsory for companies to issue a disclaimer on each press release stating that the VSE “neither approves nor disapproves of their contents”. This case goes back 40 years, so limited information is available on it. A bit more discussion on this case and discussing the VSE is found at the link below.  While the VSE no longer exists, the TSX has taken over.
Link 1
Falsifying Assay Data: This example involves Southwestern Resources, a company with the Boka Project in China. The former CEO and President, John Paterson, was the company’s QP. In 2007, a month after Paterson’s resignation, Southwestern announced there were errors in previously reported assay results. As a result, Southwestern withdrew all of its previously disclosed results for that project. Sounds familiar? An independent investigation by Snowden led to a revised resource estimate that was substantially less than previously reported and identified 433 discrepancies in gold grades reported in dozens of 2003 and 2007. The original assay certificates were sent to Paterson and he was the sole recipient. Instead of transferring the true assay certificate data, Paterson transferred data containing discrepancies into the database. There was 6 years of jail time involved with this case.
Link 1 
Link 2
Link 3
Link 4 
Falsified Resource Estimate: This one goes back to 1997, although sanctioning of parties was only done in 2007. The company geologist was accused of several things, including not having adequate data to support the findings in his 1997 resource report; the methods used to calculate resources were not appropriate; the report portrayed the project as more advanced than it was; the $129 projected share value was based on “unsubstantiated tonnage and grade information and data.”. Exotic assaying methods and duping accredited investors was also part of this operation.
Link 1
Using Exploration Targets in Economic Analysis: This event goes back to 2012 and involves a company breaking the rules by disclosing the results of an economic analysis that included a target for further exploration (pie-in-the-sky) of the company’s gold mining operation. The economic analysis was not based on a current resource estimate. The punishment was the proponents had to pay to the commission $20,000 and complete a course of study on the requirements of Canadian mining rules.
Link 1  

Conclusion

This ends Part 1 of this blog post. Part 2 will continue with a few more examples, specifically involving Qualified Persons, and can be found at this link Junior Mining Shams and Scams – Part 2 
Discipline is typically rendered in two ways; the Security Commission may prosecute; or the professional associations will provide sanctions. Typically, the professional association penalties are more lenient, consisting of a temporary license suspension and the payment of legal fees.
If readers have any other examples of such junior mining stories, email them to me at kjkltd@rogers.com and I can add them to this blog.


Note: You can sign up for the KJK mailing list to get notified when new blogs are posted. Follow me on Twitter at @KJKLtd for updates and other mining posts. The entire blog post library can be found at https://kuchling.com/library/
Share

Don’t Cut Corners, Cut Cross-Sections Instead

Exploration cross-section
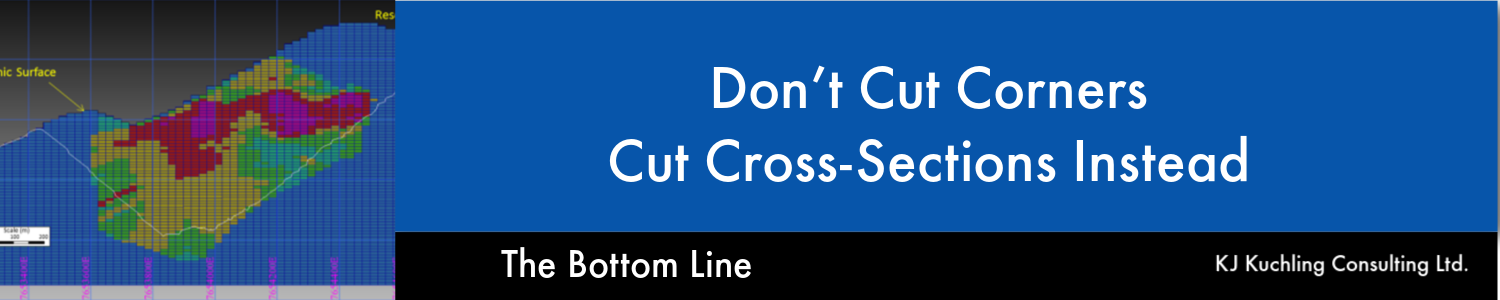
This article is about the benefit of preparing (cutting) more geological cross-sections and the value they bring.
Geological sections are one of the easiest ways to explain the character of an orebody. They have an inherent simplicity yet provide more information than any other mining related graphic.
Some sections can be simple cartoon-like images while others can be technically complicated, presenting detailed geological data.
Cartoon-stylized sections are typically used to describe the general nature of the orebody. The detailed sections can present technical data such as drill hole traces, color coded assays intervals, ore block grades, ore zone interpretations, mineral classifications, etc.
Sections provide a level of clarity to everyone, including to those new to the mining industry as well as those with decades of experience.
This article briefly describes what story I (as an engineer) am looking for in sections. Geologists may have a different view on what they conclude when reviewing geological sections.
I will describe the three types of geological sections that one can cut and what each may be describing. The three types are: (1) longitudinal (long) sections; (2) cross-sections; (3) bench (level) plans. Each plays a different role in helping to understand the orebody and mining environment.
There is also another way to share simple geological images via3D PDF files. I will provide an example later.

Longitudinal (Long) Sections

Geological long section examples
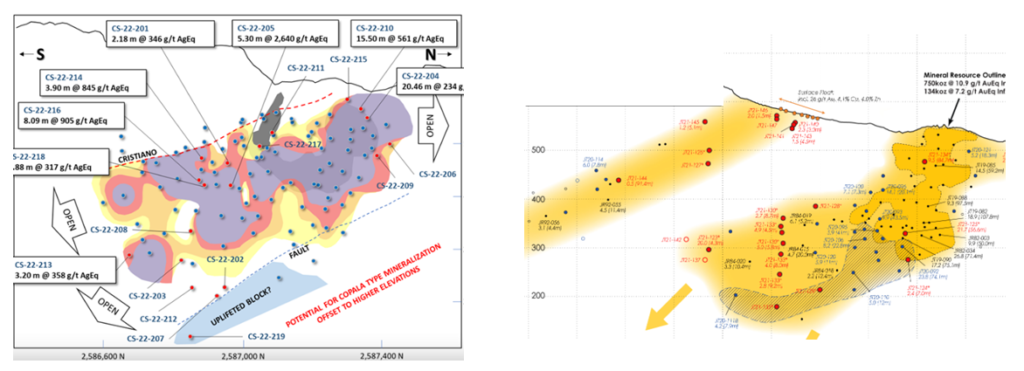
Long sections are aligned along the long axis of the deposit. They can be vertically oriented, although sometimes they may be tilted to follow the dip angle of an ore zone.
Long sections are typically shown for narrow structure style deposits (e.g. gold veins) and are typically less relevant for bulk deposits (e.g. porphyry).
The information garnered from long sections includes:
  • The lateral extent of the mineralized structure, which can be in hundred of metres or even kilometers. This provides a sense for how large the entire system is. Sometimes these sections may show geophysics, drilling to defend the basis for the regional interpretation.
  • Long sections will often highlight the drill hole pierce points to illustrate how well the mineralized zone is drilled off. Is the ore zone defined with a good drill density or are there only widely spaced holes? As well, long sections can show how deep ore zone has been defined by drilling. On some projects, a few widely spaced deep holes, although insufficient for resource estimation purposes, may confirm that the ore zone extends to great depth. This bodes well for potential development in that a long life deposit may exist.
  • Sometimes the long section drill intercept pierce points can be contoured on grade, thickness, or grade-thickness. This information provides a sense for the uniformity (or variability) of the ore zone. It also shows the elevations of the higher grade zones, if the deposit is more likely an open pit mine, an underground mine, or a combination of both.

Cross-Sections

Geological pit section
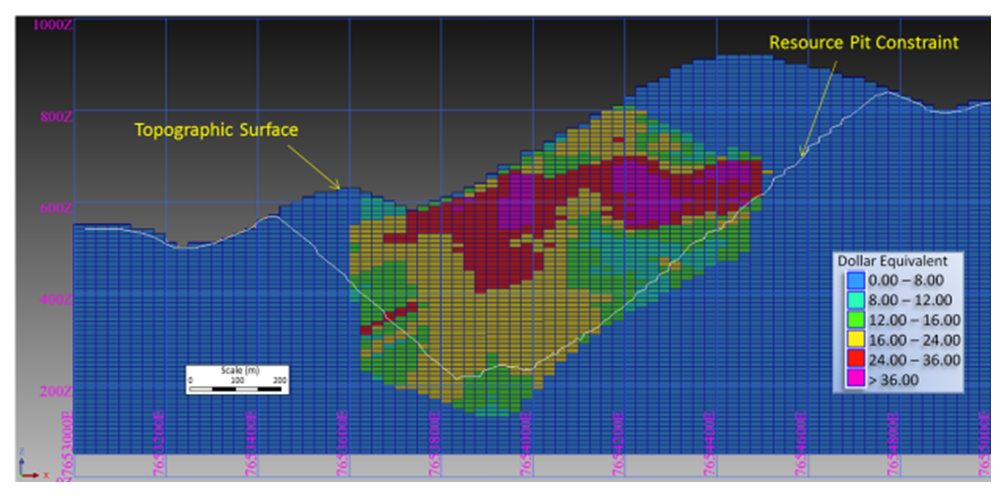
Cross-sections are generally the most popular geological sections seen in presentations. These are vertical slices aligned perpendicular to the strike of the orebody. They can show the ore zone interpretation, drill holes traces, assays, rock types, and/or color-coded resource block grades.
As an engineer, my greatest interest is in seeing the resource blocks, color coded by grade. Sometimes open pit shells may be included on the section to define the potential mining volume. The engineering information garnered from block model cross-sections includes:
  • Where are the higher-grade areas located; at depth or near surface?
  • If a pit shell profile is included, what will the relative strip ratio look like? Are the ore zones relatively narrow compared to the size of the pit?
  • How will the topography impact on the pit shape? In mountainous terrain, will a push-back on pit wall result in the need to climb up a hillside and create a very high pit slope? This can result in high stripping ratios or difficult mining conditions.
  • Does the ore zone extend deeper and if one wants to push the pit a bit deeper, is there a high incremental strip ratio to do this? Does one need to strip a lot of waste to gain a bit more ore?
  • Are the widths of the mineable ore zones narrow or wide, or are there multiple ore zones separated by internal waste zones? This may indicate if lower-cost bulk mining is possible, or if higher cost selective mining is required to minimize waste dilution.
  • How difficult will it be to maintain grade control? For example, narrow veins being mined using a 10 metre bench height and 7 metre blast pattern will have difficulty in defining the ore /waste contacts.
  • Cross-sections that show the ore blocks color coded by classification (Measured, Indicated, Inferred), illustrate where the less reliable (Inferred) resources are located and how much relative tonnage may be in the more certain Measured and Indicated categories.
Geological cross-section example
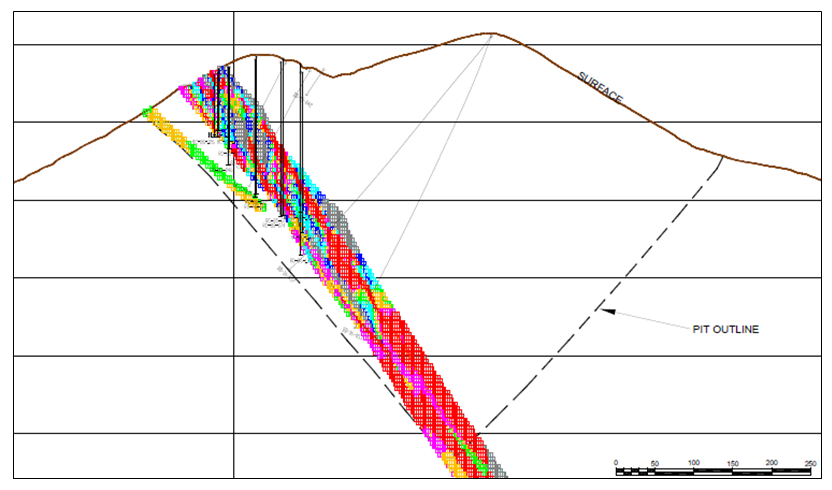
When looking at cross-sections, it is always important to look at multiple cross-sections across the orebody. Too often in reports one may be presented with the widest and juiciest ore zone, as if that was typical for the entire orebody.  It likely is not typical.
Stepping away from that one section to look at others is important. Possibly the character of the ore zones changes and hence its important to cut multiple sections along the orebody.

Bench (Level) Plans

Mining Bench Plans
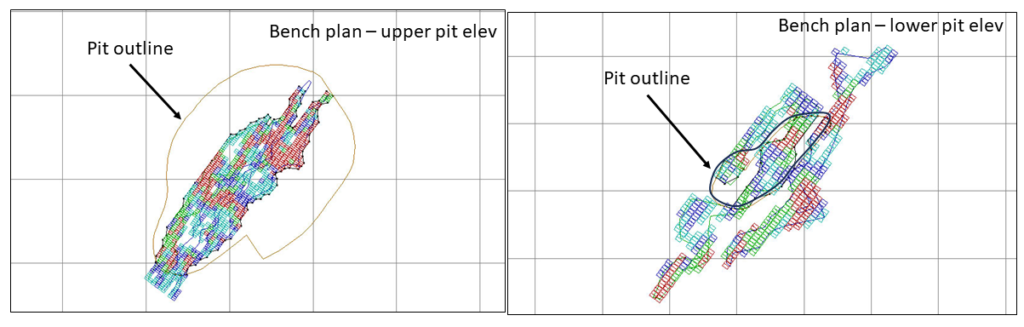
Bench plans (or level plans) are horizontal slices across the ore body at various elevations. In these sections one is looking down on the orebody from above.
Level plans are typically less common to see in presentations, although they are very useful. The level plans may show geological detail, rock types, ore zone interpretations, ore block grades, and underground workings.
The bench plan represents what the open pit mining crews would see as they are working along a bench in the pit. The information garnered from bench plans that include the block model grades includes:
  • Where are the higher-grade areas found on a level? Are these higher grade areas continuous or do they consist of higher grade pockets scattered amongst lower grade blocks?
  • Do the ore zones swell or pinch out on a bench? A vertical cross-section may give a false sense the ore zones are uniform. The bench plan gives an indication on how complicated mining, grade control, and dilution control might be for operators.
  • Do the ore zones on a bench level extend out beyond the pit walls and is there potential to expand the pit to capture that ore?
  • On a given bench what will the strip ratio be? Are the ore zones small compared to the total area of the bench?
As recommended with cross-sections, when looking at bench plans, one should try to look at multiple elevations.  The mineability of the ore zones may change as one moves vertically upwards or downwards through a deposit.

Never mind cross-sections – give me 3D

While geological sections are great, another way to present the orebody is with 3D PDF files to allow users to view the deposit in three-dimensions. Web platforms like VRIFY are great, but I have been told they sometimes can be slow to use.
Mining 3D PDF file3D PDF files can be created by some of the geological software packages. They can export specific data of interest; for example topography, ore zone wireframes, underground workings, and block model information. These 3D files allows anyone to rotate an image, zoom in as needed and turn layers off and on.
You can also create your own simplistic cross-sections through the pdf menus (see image).
A simple example of such a 3D PDF file can be downloaded at this link (3D DPF File Example). It only includes two pit designs and some ore blocks to keep it simple.
The nice thing about these PDF files is that one doesn’t need a standalone viewer program (e.g. Leapfrog viewer) to view them. They are also not huge in size. As far as I know 3D PDF files only work with Adobe Reader, which most everyone already has.  It would be good if companies made such 3D PDF files downloadable along with their corporate PowerPoint presentations.

Conclusion

Exploration cross-section example
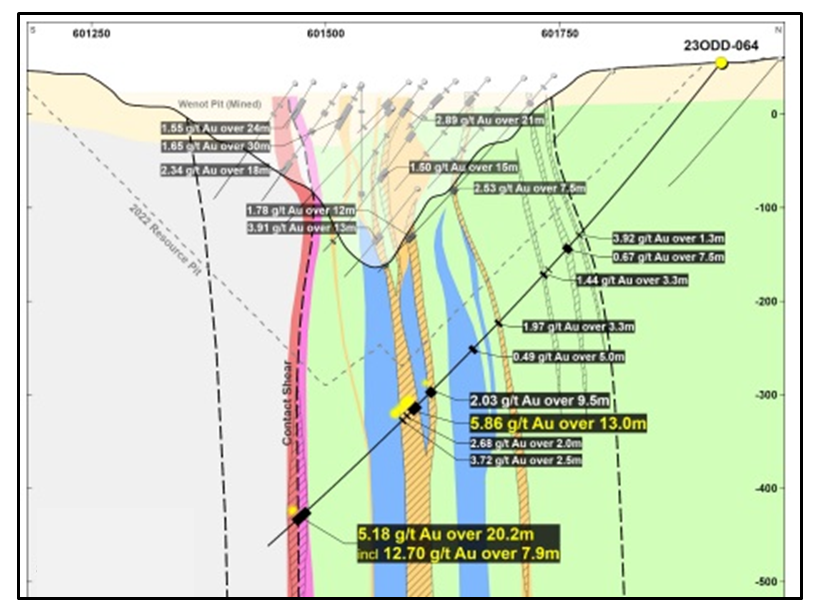
The different types of geological sections all provide useful information. Don’t focus only on cross-sections, and don’t focus only on one typical section.  Create more sections at different orientations to help everyone understand better.
In 2019 I wrote an article describing the lack of geological cross-sections in many 43-101 technical reports. The link to that article is her “43-101 Reports – What Sections Are Missing?
Geological sections are some of the first items I look for in a report. Sometimes they can be hidden away in the appendices at the back of the report. If they are available, take the time to actually study them since they can explain more than you realize.
Note: You can sign up for the KJK mailing list to get notified when new blogs are posted. Follow me on Twitter at @KJKLtd for updates and other mining posts. The entire blog post library can be found at https://kuchling.com/library/
Share

Polymetallic Drill Results – Interesting or Not?

A while ago I posted an article about how one can evaluate the economic potential of a gold deposit using early-stage exploration intercepts.  That article can be found at this link.   Doing the same evaluation for a polymetallic deposit is a bit more challenging.  There will be different metals of interest, with variable grades, prices, and process recoveries.
When disclosing polymetallic drill results, many companies will convert the multiple metal grades into a single equivalent grade.  I am not a big proponent of that approach.
I prefer using the rock value, whether calculated as a recoverable “NSR dollar value per tonne” or as an “insitu value per tonne”.  Either rock value is fine for my purposes.
Interestingly NI 43-101 prohibits the disclosure of insitu rock value but allows the use of metal-equivalents.  In my view this is a bit counter-intuitive since the equivalent grade  can be more misleading than rock value.

What can drill intercepts show

The three aspects that interest me the most when looking at early-stage drill results are:
  1. The economic value of the rock (in $/t tonne). This can either be “insitu value” (assuming 100% recovery, 100% payable) or the “NSR value” incorporating recovery and payable factors (if available).   Personally, the 100% insitu value is simpler to calculate and assess.
  2. The depth to the top of the economic zone, which indicates if this deposit would be a lower cost open pit mine or must be a higher cost underground mine.
  3. The length of the economic intervals, which indicates whether bulk mining approaches are viable versus the need to selectively mine narrow ore zones. The economic interval lengths also give a sense for the potential tonnage size (i.e. is it a big deposit or a small one).
There are two types of early-stage exploration data that can be examined with respect to the three items of interest described above.  They are (i) the drill hole assay data and (ii) the drill hole "intercepts of interest".  I will show an example of each in this post using sample data from an actual exploration program.
One can examine individual drill hole assays to calculate the rock value profile along each drill hole.  One can also examine the rock values for the major and minor intervals of interest reported in company news releases.
I normally like to examine both, but the intervals of interest data is publicly disclosed and more readily available.  Drill hole assays are often a bit harder, if not impossible, to track down.

Economic Parameters

In a polymetallic deposit, the insitu rock value is simply the summation of value of the individual metal, based on their respective assay grades.   An NSR rock value would apply an adjustment for metal recoveries and smelter payables, thereby lowering the insitu rock value somewhat.  However the insitu value is fine if there is no metallurgical or process data to rely upon.
Next one must determine what insitu rock value is deemed potentially economic, i.e. the breakeven cutoff.
One can estimate a processing cost and G&A cost.  In an open pit scenario, one doesn’t include the mining cost since the goal is to decide whether to send a truck to the waste dump or to the crusher. Only the processing and G&A cost musts be recovered by the ore value.   In an underground mining scenario, one would include the mining cost in the cutoff calculation.
In our example, lets assume a unit processing cost of $12/t and a G&A cost of $$2/t, for a combined cost of $14/t.    If we envision a metal recovery range of 75%-95%, we can assume 85% for now.
If we envision a smelter payable range of 75% to 95%, we will assume 85% for that also.
The “NSR factor” would now be 85% x 85% or 75%. Therefore, if the breakeven cost is $14/t, then one should target to mine rock with an insitu value greater than $20/tonne  (i.e. $14 / 0.75). This would be the approximate ore vs waste cutoff.  It is still only ballpark estimate at this  early stage, but good enough for this type of review.
Normally it would be nice to see the average head grade (or rock value) at 3 to 4 times greater than the cutoff grade.  This is not a necessity but it is a positive factor.
For example, in a gold deposit with a 0.3 g/t cutoff, one would like to see average head grades at least 0.9 to 1.2 g/t or more.  If the average head grade is close to the cutoff grade, then possibly the orebody tonnage may be very sensitive to changes in cutoff.  This may not be a good thing.
In our example, with a breakeven cutoff rock value of $20/t, one would like to see some ore zones with insitu values 3-4x higher, or above $60 - $80/t.   We can target >$70/t rock as a "nice to have" with $20/t as the cutoff.
So far, its all pretty simple. Let’s look at some actual exploration data to see how to apply this approach.
Our example will be a polymetallic deposit containing four metals of interest; copper, gold, cobalt, and iron.  One can examine  a few drill holes as well as the intervals of interest.
Metal prices used in this example are Cu = $4/lb, Au = $1980/oz, Co = $15.50/lb, Fe concentrate = $100/tonne, assuming 100% recovery and 100% payable for everything.

Drill Hole Assays Examples

The following three graphs show down hole profiles for Drill Holes A, B, C.  For each hole there are two plots. One plot shows the insitu rock values down the hole.  The second plot is the same, except the x-axis minimum has been set to the breakeven cutoff value of $20/t. This is done simply to highlight the potentially economic zones.
Hole A:
Shows positive economic results with ore quality rock starting near surface and extending down to 120 metres.
While many of the assay values are between $20-$70/t there are a significant number exceeding $70/t.
This hole has good economic potential for production.
Polymetallic drill hole evaluation
Hole B:
Shows positive economic results with economic rock starting near surface.  There are multiple economic zones extending all the way down to 370 metres.
The upper part of the hole, from 40m to 100m, shows multiple assay values exceeding the $70 target.
A second potentially economic zone is seen at a depth of 130m to 190m, which is still within the open pit mining range.
This hole also has good economic potential.
Polymetallic drill hole evaluation
Hole C:
For comparison purposes, Hole C is neutral in that while there are multiple potentially economic zones, they have lower insitu value.
This hole doesn't have the economic consistency that was seen in Holes A and B.
Possibly this hole may be near the edge of the ore body, in which case such a profile is not unexpected.
Polymetallic drill hole evaluation
Normally I would not spend a lot of time examining holes with little to no grade.  Some may consider this as a biased view.   However, every orebody has its limits, and what is occurring along the edges isn’t that critical in my view.
My objective is to understand what is happening in the core of the orebody, since that is what will dictate the overall economics.  Is the core of the orebody marginal value, or does it consist of high value rock?   Ultimately it will be the exploration company's task to keep drilling to define if there is sufficient tonnage of this higher value rock to justify a mine.  However this shows that at least the grades are there.

Intervals of Interest Example

The next series of plots examines the insitu rock values over drill intervals typically published in a company news releases. The intervals of interest will composite the individual assays over larger widths based on the company’s technical judgement.
It is interesting to see whether the larger intervals have good economic potential.   The following charts combine both major intervals with minor zones, often referred to as “including” in news releases. Both major and minor intervals can provide useful information.
Insitu Rock Value vs Depth:
This chart shows the rock values for multiple report intervals versus their depth (top) along the hole.
One can see multiple intervals at open pit depths (<250 m) with insitu values above the $20/t cutoff and above the $70/t threshold.
Within the upper 250 metres, we are seeing multiple intervals with good value.  That is a positive sign.
Note that these depths are not depths from surface, but distance along the drill hole.  In reality the intervals may be slightly closer to surface, depending on the hole inclination.
Polymetallic assay interval evaluation
Insitu Rock Value vs Interval Length:
The next question to ask is whether the higher value zones are narrow or wide?
In the example here one can see some wide zones (70 to 90m) with rock values in the range of $40-70/t.   These are good open pit mining widths.
There are numerous higher grade zones ($70-$200/t) in the 5m to 20m width range.   These widths are still fine for open pit mining.
Some intervals are quite narrow (<5m), being a bit more difficult to mine.  Since many of these are higher grade, they will tolerate some mining dilution.
Polymetallic assay interval evaluation

Conclusion

Although publishing insitu rock values is prohibited by NI-43-101, I find them important in my understanding the economic potential of a deposit. Reviewing the insitu rock values spatially is not difficult and can shed light on what is there. Even at a very early stage, one can get a sense of economic character of the orebody.   This is a great approach to use when doing an acquisition due diligence on an exploration stage project consisting mainly of drill hole data.
In my view, it would be beneficial if all polymetallic drill results were reported with the individual grades and using a standardized industry wide insitu rock value formula. Then one could compare projects (or even different zones on the same project) on an equal basis.   The cutoff to be applied to different projects would vary but the insitu value is what it is.
This might be better than each company applying their own unique equivalent grade calculation to their exploration results.
The equivalent grade calculation still requires assumptions on the metal prices and recoveries.  The result is, unfortunately, presented as a grade value rather than a dollar value.
The intervals of interest published in news releases are usually not available for download.   Great Bear is (was) one example where the data was available.  It would be nice if more companies followed suit by releasing their interval data in CSV or Excel format.  It worked out well for Great Bear!
Perhaps the detailed hole assay data may be too complex or voluminous to release.  Maybe this level of information is not useful except to the more technically driven investors. Nevertheless it would still be nice to have access to this drill data in electronic form, at least in the core of the orebody.
For further light reading, the two previous articles referenced above are “Gold Exploration Intercepts – Interesting or Not?" and "Metal Equivalent Grade versus NSR for multi-metals – Preference?"
Note: You can sign up for the KJK mailing list to get notified when new blogs are posted. Follow me on Twitter at @KJKLtd for updates and other mining posts.   The entire blog post library can be found at https://kuchling.com/library/
Share

Let A.I. Help Target Your Infill Drilling

From time to time I come across interesting new tech that I like to share with colleagues.  The topic of this blog relates to solving the problem of defining an optimal infill drill program.
In the past I have worked on some PEA’s whose economics were largely based on Inferred ore.  The company wanted to advance to the Pre-Feasibility (PFS) stage. However, before the PFS could start they would need additional drilling to convert much of the Inferred resource into Measured and Indicated resources.
I’ve seen similar experience with projects that are advance from PFS to FS where management has a requirement that the ore mined during the payback period consist of Measured classification.

The Problem

In both cases described above, it is necessary for someone to outline an infill drill program to upgrade the resource classification while also meeting other project priorities.  The goal is to design an infill drill program with minimal time and cost yet maximize resource conversion.  Possibly some resource expansion drilling, metallurgical sampling, and geotechnical investigations may be required at the same time.
I’m not certain how various resource geologists go about designing an infill drill plan.  However, I have seen instances where dummy holes were inserted into the block model and then the classification algorithm was re-run to determine the new block model tonnage classification.   If it didn’t meet the corporate objectives, then the dummy holes may be moved or new ones added, and the process repeated.
One would not consider such a trial & error solution as optimal. It may not necessarily meet the cost and time objectives although it may meet the resource conversion goals.

The Solution

The DRX Drill Hole and Reporting algorithm developed by Objectivity.ca uses artificial intelligence to optimize the infill drilling layout.  It intends to match the QP/CP constraints with corporate/project objectives.
For example, does company management require 70% of the resource in M&I classifications or do they require 90% in M&I?  Each goal can be achieved with a different drill plan.
The following description of DRX is based on discussions with the Objectivity staff as well as a review of some case studies.  The company is willing to share these studies if you contact them.
The DRX algorithm relies on the resource classification criteria specified by the company QP.  For example, the criteria could be something like “For a block to qualify as Measured, the average distance to the nearest three drill holes must be 30 m or less of the block centroid. For a block to qualify as Indicated, the average distance from the block centroid to the nearest three holes must be 50 m or less. For a block to qualify as Inferred it will generally be within 100 m laterally and 50 m vertically of a single drill hole.
The DRX algorithm will use these criteria to optimize drill hole placement three dimensionally to deliver the biggest bang for the buck.   Whatever the corporate objective, DRX will attempt to find an optimal layout to achieve it.  The idea being that fewer well targeted holes may deliver a better value than a large manually developed drill program.
The DRX outcome will prioritize the hole drilling sequence in case the drill program gets cut short due to poor weather, lack of funding, or the arrival of the PDAC news cycle.
The DRX approach can also be used to optimally site metallurgical holes and/or geotechnical holes in combination with resource drilling if there are defined criteria that must be met (by location, ore type, rock type, etc.).   The algorithm will rely on rules and search criteria developed by experts in those disciplines.  It does not develop the rules, it only applies them.
DRX can also help optimize step-out drilling, such that the step-out distance will not be beyond the range that negates the use of the hole in a resource estimate.  It can also consider geological structure in defining drill targets.

By optimizing the number of drill holes and their orientation, the company may see savings in drill pad prep, drilling costs, field support costs, and sample assaying.
One can even request drilling multiple holes from the same drill pad to minimize drill relocation costs and safety issues in difficult terrain.
A large benefit of DRX is to be able to examine what-ifs.  For example, one may desire 85% of the resource to be M&I.   However, if one is willing to accept 80%, then one may be able to save multiple holes and associated costs.   Perhaps with the addition of just a few extra holes one could get to 90% M&I.   These are optimizations that can be evaluated with DRX.

An Example

In the one case study provided to me, a $758,000 manually developed drill program would convert 96.6% of the Inferred resource to Indicated.  DMX suggested that they could achieve 96.7% for $465,000. Alternatively they could achieve 94% conversion for $210,000.  These are large reductions in drilling cost for small reductions in conversion rate.  This may allow the drill-metres saved to be used for other purposes.
For that same project, a subsequent study was done to convert Indicated to Measured in a starter pit area. DRX concluded that a 5000-metre program could convert 62% of Indicated into Measured.  A 12,000-metre program would convert 86%,  A 16,000-metre program would achieve 92%.
So now company management can make an informed decision on either how much money they wish to spend or how much Measure Resource they want to have.

Conclusion

Although I have not yet worked with DRX, I can see the value in it.   I look forward to one day applying it on a project I’m involved with to develop a better understanding of what goes in and what comes out.   DRX hopes to become to resource drilling what Whittle has become to pit design – an industry standard.
The use of the DRX algorithm may help mitigate situations where, moving from a PEA to PFS, one finds that the infill program did not deliver as hoped on the resource conversion.  Unfortunately, this leaves the PFS with less mineable ore than anticipated and sub-optimal economics.
New tech is continually being developed in the mining industry.  Hopefully this is one we continue to see forward advancement. It makes sense to me and DRX could be another tool in the geologist toolbox.  Check out their website at objectivity.ca
Note: You can sign up for the KJK mailing list to get notified when new blogs are posted.   Follow me on Twitter at @KJKLtd for updates.
Share

Gold Exploration Intercepts – Interesting or Not?

As a mining engineer, I am not usually called in to review a project that is still at the exploration stage. This is normally the domain of the geologist. However from time to time I have an interest in better understanding the potential of an early stage mining project. This could be on behalf of a client, for investing purposes, or just for personal curiosity.
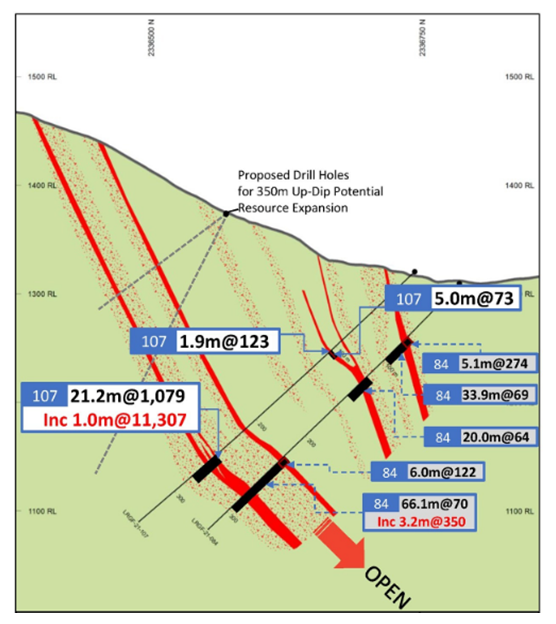
At the exploration stage one only has drill interval data from news releases to examine. A resource estimate may still be unavailable.
The drill data can consist of long intervals of low grade or short intervals of high grade and everything in between. What does it all mean and what can it tell you?
The following describes an approach I use for examining early stage gold deposits. The logic can be expanded to other metals but would take more effort.
My focus is on gold because it has been the predominant deposit of interest over the last few years, and it is simpler to analyze quickly.

We All Like Scatter Plots

My approach relies on a scatter plot to visual examine the distribution of interval thicknesses and gold grades. Where these data points cluster or how they are distributed can provide some prediction on the overall economic potential of a project. Its not a guarantee, but only an indicator.
I try to group the analysis into potential open pit intervals (0 to 200 metres from surface) and potential underground (deeper than 200m) intervals. This is because a 20m wide interval grading 2.0 g/t is of economic interest when near surface, however of less interest if occurring at a 300m depth.
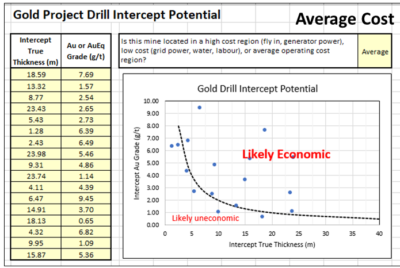
Using information from a news release, I create a two column Excel table of highlighted intervals and assay grades. The nice thing about using intervals is that the company has provided their view of the mineable widths.
If one is provided with raw 1-metre assay data you would have to make that decision, which can be a significant task. The company has already helped make those decisions.
Normally I tend to use the highlighted sub-intervals and not the main intervals since issues with grade smoothing can occur.
A large interval containing multiple high grade sub-intervals may see some grade smoothing.This happens if the grade between sub-intervals is very low grade or even waste. It takes a fair bit of effort to assess this for each drill hole, hence it is easier to work with the sub-intervals.
I have an online calculator (Drill Intercept Calculator) that lets you assess if grade smoothing is occurring.
When inputting the interval thickness, I prefer to use the true thickness and not the interval length. If the assay information does not specify true thicknesses, then I simply multiple the interval length by 0.70 to try to accommodate some possible difference in width. Its all subjective.
The assays can consist of Au (g/t) or AuEq (g/t) if more metals are present. If very high grades are encountered (greater than 10 g/t) I simply input 9.9 g/t into the Excel table so they fit onto my scatter plot. Extremely high grades can be sporadic and localized anyhow.
Finally I need to decide whether the project is located in a region of high operating cost, low cost or about average costs. High costs could be with a fly in/ fly out, camp operation, with diesel power, and seasonal access.
A low cost operation could be in temperate climate, with good access to local infrastructure, water, labour, and grid power. An average operation would be somewhere in between the two. Its just a gut feel.

Results

The following charts describe how it works, using randomly generated dummy assay data in this example.
In the Average cost scenario (left chart) the points are equally scattered both above and below the Likely Economic line. As one moves to a high-cost situation (middle chart) the curve moves upwards and more drill intervals now fall below the economic line.
This would give me an unfavorable impression of the project. The third graph is the Low-Cost scenario and one can see that more assays are now above the line. Hence the same project located in a different region would yield a different economic impression.
The economic boundaries (dashed lines) presented in the plots are based on my personal experience and biases. Other people may have different criteria to define what they would view as economic and uneconomic intervals.

Conclusion

There is not much that a layperson person can do with the multitude of exploration data provided in corporate news releases. However, by aggregating the data one can get a sense of where a gold project positions itself economically. The more data points available, the more that one can gather from the plot.
One should prepare separate plots for shallow and deep mineralization or for different zones and deposits on a property rather than aggregate everything together.
It may be possible to undertake a similar analysis with different commodities if one can summarize the assays into a single equivalent value or NSR dollar value. Unfortunately, exploration news releases don’t often include the poly-metallic interval equivalent grade or NSR value. Calculating these manually would add an extra step in the process, however it can be done.
If you want to try out the concept, I have posted the online spreadsheet to my website at the link Drill Intercept Potential where you can input Au exploration data of interest. Unfortunately, you cannot save your input data so it’s a one time event.   Anyone can do this – its not rocket science.
Let me know your thoughts, suggestions, or other ways to play with news release data.
If your project contains metals other than gold, then the rock (or ore) value will be based on the revenue from a combination of metals.   How to approach this in discussed in another blog post titled Ore Value Calculator – What’s My Ore Worth?

Great Bear Resources Example

Interesting the Great Bear Resources website allows one to download a data file with all their exploration intervals.  I have not seen another company provide this level of transparency.   I download their data file of over 1300 intervals and sub-divided them into major intervals and sub-intervals (more ore less).   The two plots below show the outcome.
The graph on the left is the sub-intervals showing that many points are above the “economic” line.  There are numerous data points along the top axis, indicating many sub-intervals at >10 g/t at widths ranging from 1 to 15 metres.  The graph on the right shows the major intervals.  While there are still many along the top axis, there are now more along the 40m width but at grades ranging from 1 g.t to 6 g/t.
One would surmise from these plots that overall there are many intervals above the line in the economic zone, showing the potential of the project.  It also shows that GBR have encountered many intervals likely sub-economic, but that’s the exploration game.

Great Bear Resources data

Examining polymetallic drill results in a similar manner isn’t as simple as this.   The mutiple metals of interest make the calaculations a bit more complex.   Another blog post discusses the approach I use for polymetallic, at this this link Polymetallic Drill Results – Interesting or Not?
Note: You can sign up for the KJK mailing list to get notified when new blogs are posted. Follow me on Twitter at @KJKLtd for updates and insights.
Share

A Mining Career or a Travel Club

There have been some LinkedIn discussions about why the mining industry needs to attract more young people.  One of the selling points often mentioned is how mining gives a person the opportunity to experience the world.
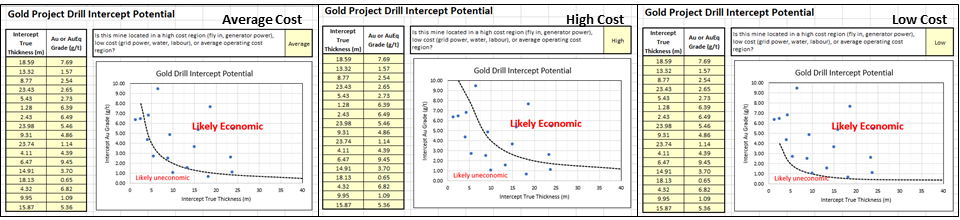
Based on my own career, mining has definitely provided me with a chance to travel the world.  It will also help anyone overcome their fear of travel.   One will also learn that both international and domestic travel can be as equally rewarding.  There is nothing wrong with learning more about your own country.
The main purpose for my mining travel was due to either being a QP on a 43-101 study or visiting a site as a member of a due diligence team.   Other reasons have been to provide engineering support at a mine site or to meet with management teams for risk or strategy planning sessions.
Over the last year I haven’t traveled as much as in the past.  One reason is that not every QP working on a 43-101 report has to make a site visit. Fortunately, even when one doesn’t make a site visit, one still learns something about the local politics, legal system, infrastructure, and socio-economic situation in that country.
The map below shows places where I have been in my travels.  It also shows the locations of studies I was involved it. Mining really is a global business.   My map isn’t as cluttered as that of some geologists I know.  Exploration and resource geologists will visit many more destinations that an engineer will. After all, every project needs exploration drilling and a resource estimate, but not all projects advance to the engineering stage.

For those thinking of getting into mining, here is my list of pros and cons based on my own travel experience. Not everything is great about travel but some aspects of it can be fantastic.

What’s Good

  • I had the opportunity to visit many places for which there is a zero probability that I would have ever gone as a tourist.
  • Typically long duration long distance flights are in business class. You get lounge access and the perks associated with executive travel.   Less onerous short flights might be economy only, so be aware of your company policy.
  • All travel expenses, hotels, taxis, meals, etc. are paid for.  Just don’t get too exorbitant when wining and dining.  That’s the job of the senior person you are travelling with.
  • Upon arrival, often there will be a company representative to meet you at the airport.  They speak the local language and will take you where you need to go.  This saves you scrambling around an airport looking for a safe taxi to use.
  • You will get to meet local employees, go to dinner with them, travel around their country, and chat in the evenings. It’s a great way to learn about the people in the country you are visiting.
  • You will get to meet other technical people from around the world.  They might be expats working at a mine site or simply part of a multidisciplinary engineering team on the same visit.
  • You will be whisked away from tourist traps and thus have an opportunity to see the real countryside.
  • You will hit the ground running, get to visit mine sites, see some real live rocks, drill core, pit walls, equipment at work, and things happening.  You won’t get to see that while sitting in your downtown office.

What’s not so good

  • Unfortunately business trips are mostly of a very short duration since you’re not going there as a tourist.  You’re being paid for your time and expertise.

  • Mining trips are usually not to majors centers, so once arriving in the country you really haven’t arrived yet.  There might be more air flights or long pickup truck rides to get to the final destination. There can be a lot of waiting and the days can be long (and frustrating).   I remember on trip in northern Russia where four of us with luggage were jammed into a Volkswagen Rabbit in a snowstorm. That two hour trip took five hours, but we were just happy to make it back to the hotel.
  • Sometimes your accommodations will be less than stellar, i.e. one star hotels or tents.  So you’ll need to learn how to appreciate the charm of those places and not complain that it isn’t the Four Seasons Hotel.
  • Some travel locations can be potentially unsafe and require travelling security. That can lead to a bit of uneasiness.  I recall a trip to northern Mexico where we had two armed guards travelling with us.  I’m not sure if they were really needed and it was strangely more calming without them once they left.
  • Long east-west trips can leave you jet lagged and dog-tired. However the expectation is that at 7 am next morning you’re ready for breakfast and then head straight into the office.  You’re being paid to get to work, not to sleep.
  • The site visits will be focused on collecting or reviewing data and then immediately travelling back home to write your report.  Sightseeing opportunities can be limited other than what you will see during the course of your work. Sometimes you’ll get back home and think that you never really saw the place.

Conclusion

Business travel has always been one of the best parts of my mining career.   I can remember the details about a lot of the travel that I did.   Unfortunately the project details themselves will blur with those of other projects.
When I do travel now, it’s a nice change if just one flight gets you to your final destination.
During this Covid period, international travel is greatly restricted.  It will be interesting to see how soon things can return to normal, if they ever do.   To miss out on the travel aspect of a mining career would be a shame, unless the only travel you want to experience is sitting on public transit for a few hours each day.
By the way, my all time favorite place for a mining trip is…..Argentina.  It’s a long way from Toronto, but well worth it.


Note: You can sign up for the KJK mailing list to get notified when new blogs are posted.   Follow me on Twitter at @KJKLtd for updates and insights.
Share

43-101 Reports – What Sections Are Missing?

Recently as part of a due diligence I was reviewing a couple of 43-101 technical reports and something jumped out at me. There were pages and pages of statistical plots. The plots included QA/QC and check assay diagrams, variograms, box plots, swath plots, and contact plots. There was no lack of statistical information. However, as a mining engineer, there was something missing that was of interest to me. Good geological sections were missing.
Its seems that most technical reports focus heavily on describing the mathematical aspects of the resource, but spend less time describing the physical aspects of the geology and the mineability.

Who is the audience

It’s always open to debate who these 43-101 technical reports are intended for. Generally we can assume correctly that they are not being written mainly for geologists. However if they are intended for a wider audience of future investors, shareholders, engineers, and C-suite management, then (in my view) greater focus needs to be put on the physical orebody description.
Understanding the nature of the orebody brings greater understanding of the entire project.

Everyone likes geology

Whenever I listen to investor conference calls, many of the analyst’s questions relate to the resource and the mining operation. Essentially the participants want to know if this will be an “easy” mine or a “hard” mine.
One simple way to explain this is with good geological sections. They help everyone understand any potential issues; i.e. a picture is worth a thousand words. Good cross-sections will describe the following aspects.
  • The complexity (or simplicity) of the ore zones,
  • The width of the ore zones,
  • The vertical extent of geological information,
  • The drill spacing and drilling density,
  • The spatial distribution of assay information,
  • The grade distribution laterally and vertically,
  • The waste distribution throughout the mine,
  • The mining block size in relation of the ore zone dimensions
One can learn a lot just by looking at well presented cross-sections.  The nice thing is that they are generally understood by non-technical people.

Suggestions

I would like to suggest that every technical report includes more focus on the operational aspects of the orebody.
My recommendation is that the following information becomes standard in all technical reports.
  1. At least three to five cross sections through the deposit. Don’t just present a best case typical cross-section.
  2. At least one or two longitudinal sections.
  3. At least three level or bench plans, showing the drill hole pierce points.
Each cross section/bench plan should consist of two parts.
Part 1 shows the drill holes with color coded grade intercepts, ore zone wireframes, and lithology or rock types.
Part 2 should be a block model cross section showing the wireframes, drill holes, and color coded block model grades using the ore/waste cutoff grade as one of the clearly defined grade bins.
It doesn’t really matter if the cross- sections are included in Section 14 or Section 16 of the Technical Report. However if they are included in Section 16 then one should overlay the pit design and/or underground stope shapes onto the sections.
I also recommend NOT incorporating these cross-sections in the appendices since they are too important to be hidden away. They should be described in the main report itself.

Conclusion

Improving the quality of information presented to investors is one key way of maintaining trust with investors. Accordingly we should look to improve the description of the mineable ore body for everyone. In many cases it is the key to the entire project.
I am not suggesting that one needs to remove the statistical plots since they do have their purpose and audience. I am simply suggesting that we should not forget about everyone else try to figured out the viability of the project.
Note: You can sign up for the KJK mailing list to get notified when new blogs are posted.
For those interested in reading other mining blogs, check out the Feedspot website at the link below. They have over 50 blog sites you check out. https://blog.feedspot.com/mining_blogs/
Share