Measured vs. Indicated Resources – Do We Treat Them the Same?

measured and indicated
One of the first things we normally look at when examining a resource estimate is how much of the resource is classified as Measured or Indicated (“M+I”) compared to the Inferred tonnage.  It is important to understand the uncertainty in the estimate and how much the Inferred proportion contributes.   Having said that, I think we tend to focus less on the split between the Measured and Indicated tonnages.

Inferred resources have a role

We are all aware of the regulatory limitations imposed by Inferred resources in mining studies.  They are speculative in nature and hence cannot be used in the economic models for pre-feasibility and feasibility studies. However Inferred resource can be used for production planing in a Preliminary Economic Assessment (“PEA”).
Inferred resources are so speculative that one cannot legally add them to the Measure and Indicated tonnages in a resource statement (although that is what everyone does).   I don’t really understand the concern with a mineral resource statement if it includes a row that adds M+I tonnage with Inferred tonnes, as long as everything is transparent.
When a PEA mining schedule is developed, the three resource classifications can be combined into a single tonnage value.  However in the resource statement the M+I+I cannot be totaled.  A bit contradictory.

Are Measured resources important?

It appears to me that companies are more interested in what resource tonnage meets the M+I threshold but are not as concerned about the tonnage split between Measured and Indicated.  It seems that M+I are largely being viewed the same.  Since both Measured and Indicated resources can be used in a feasibility economic analysis, does it matter if the tonnage is 100% Measured (Proven) or 100% Indicated (Probable)?
The NI 43-101 and CIM guidelines provide definitions for Measured and Indicated resources but do not specify any different treatment like they do for the Inferred resources.
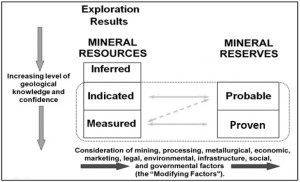
CIM Resources to Mineral Reserves

Relationship between Mineral Reserves and Mineral Resources (CIM Definition Standards).

Payback Period and Measured Resource

In my past experience with feasibility studies, some people applied a  rule-of-thumb that the majority of the tonnage mined during the payback period must consist of Measure resource (i.e. Proven reserve).
The goal was to reduce project risk by ensuring the production tonnage providing the capital recovery is based on the resource with the highest certainty.
Generally I do not see this requirement used often, although I am not aware of what everyone is doing in every study.   I realize there is a cost, and possibly a significant cost, to convert Indicated resource to Measured so there may be some hesitation in this approach. Hence it seems to be simpler for everyone to view the Measured and Indicated tonnages the same way.

Conclusion

NI 43-101 specifies how the Inferred resource can and cannot be utilized.  Is it a matter of time before the regulators start specifying how Measured and Indicated resources must be used?  There is some potential merit to this idea, however adding more regulation (and cost) to an already burdened industry would not be helpful.
Perhaps in the interest of transparency, feasibility studies should add two new rows to the bottom of the production schedule. These rows would show how the annual processing tonnages are split between Proven and Probable reserves. This enables one to can get a sense of the resource risk in the early years of the project.  Given the mining software available today, it isn’t hard to provide this additional detail.
Note: If you would like to get notified when new blogs are posted, then sign up on the KJK mailing list on the website.  Otherwise I post notices on LinkedIn, so follow me at: https://www.linkedin.com/in/kenkuchling/.
Share

Claim Fees Paid for a Royalty Interest – Good Deal or Not?

mineral property acquisition
In 2016 I read several articles about how the junior mining industry must innovate to stay relevant.    Innovation and changing with the times are what is needed in this economic climate.
One company that was trying something new is Abitibi Royalties.  They were promoting a new way for them to acquire royalty interests in early stage properties.  They were offering to fund the claim fees on behalf of the property owner in return for a royalty.
Their corporate website states that they would pay, for a specified period of time, the claim fees/taxes related to existing mineral properties or related to the staking of new mineral properties.
In return, Abitibi Royalties would be granted a net smelter royalty (“NSR”) on the property.  It may be a gamble, but it’s not a high stakes gamble given the relatively low investment needed.

Not just anywhere

Abitibi were specifically targeting exploration properties near an operating mine in the Americas. They were keeping jurisdiction risk to a minimum.   Abitibi stated that their due diligence and decision-making process was fast, generally within 48 hours.  No waiting around here but likely this is possible due to the low investment required and often the lack of geological information to do actually do a due diligence on.
To give some recent examples, in a December 14, 2015 press release, Abitibi state that the intend to acquire a 2% NSR on two claims in Quebec and will pay approximately $11,700 and reimburse the claim owner approximately $13,750 in future exploration expenses. This cash will be used by the owner towards paying claim renewal fees and exploration work commitments due in 2016.   Upon completion of the transaction, these will be the ninth and tenth royalties acquired through the Abitibi Royalty Search.  For comparison, some of their other royalty acquisitions cost were in the range of $5,000 to $10,000 each (per year I assume).   I think that those NSR interests are being acquired quite cheaply.
The benefit to the property owner may be twofold; they may have no other funding options available and they are building a relationship with a group that will have an interest in helping the project move forward.  The downside is that they have now encumbered that property with a NSR royalty going forward.
The benefit to Abitibi Royalties is that they have acquired an early stage NSR royalty quite cheaply although there will be significant uncertainty about ever seeing any royalty payments from the project.   Abitibi may also have to continue to make ongoing payments to ensure the claims remain in good standing with the owner.
It’s good to see some degree of innovation at work here, although the method of promotion for the concept may be more innovative than the concept itself. Unfortunately these Abitibi cash injections investments are not enough to pay for much actual exploration on the property and this is where the further innovation is required, whether through crowd funding, private equity, or some other means.   I’m curious to see if other companies will follow the Abitibi royalty model but extend it to foreign and more risky properties.
Note: You can sign up for the KJK mailing list to get notified when new blogs are posted.
Share

Constraints: Use Them to Your Advantage

mining study management
I recently read a business book called “A Beautiful Constraint: How to Transform Your Limitations into Advantages, and Why It’s Everyone’s Business” by Adam Morgan and Mark Barden. It describes how to use constraints, like lack of time, or money, or resources and use them to help transform your company for the better.
Here’s an Amazon link to the book.  Beautiful Constraint Book Cover
The book discusses how to shift away from the typical “victim” role by understanding how our routines control things, ask the right questions, and focus on “how” and not “if”.

Focus on HOW and not IF

A good example: one of the recommendations in the book is in your team meetings no one on your team is allowed to utter the words “we can’t because…”.  They must replace those words with “we can if…”.   This forces the generation of ideas and promotes a positive attitude rather than a victim attitude.
The book describes how many innovative ideas are due to constraints and those innovations would never have come about without those constraints.
To force innovation in your organization you can create artificial constraints for your team.  This will foster innovative thinking and push for “outside the box” ideas.  The tougher the constraint, the greater the challenge for your team.  Possibly the greater the final outcome too.
The term Theory of Constraints may be common to some.  However that concept is different than what is being discussed in the book.  The TOC essentially relies on managing a constraint or eliminating it, and then addressing the next constraint in sequence.
The book authors instead propose to exploit the constraint or leverage it to create a new possibility.  Hence the title “beautiful constraint”.

Mining has no shortage of constraints

We all know the mining industry has more than enough constraints placed upon it today. It may be lack of funding, lack of skilled talent, environmental pressures, supply-demand issues, social issues, or security issues.  Each mining project may have additional constraints, so one probably doesn’t need to create artificial constraints for the team.
The mining industry has no option but to try to use these constraints in a constructive manner.  Miners must not let them pull the industry down nor simply wait until they go away.  When people say “Mining is cyclical and it will all turn around soon.”, that’s an example of waiting for the constraint to go away.

How long do you wait before taking your own action?

The bottom line is that the book is an eye opener and enlightening.  It may be telling some of us what we already know deep inside but don’t acknowledge openly.  Don’t wait any longer, start innovating, and don’t be afraid of grand innovations.
Note: If you would like to get notified when new blogs are posted, then sign up on the KJK mailing list on the website.  Otherwise I post notices on LinkedIn, so follow me at: https://www.linkedin.com/in/kenkuchling/.
Share

Mining Takeovers – Should Governments Be (Heavily) Involved?

Mine acquisition
I have seen some on-line discussions about whether governments should be regulating corporate takeovers, some of which may be outside their own borders. The fear from some groups is that mine assets may be acquired by less than desirable acquirers.
One specific example that I have seen is related to the 2015 disposition of foreign resource assets by both Barrick and Ivanhoe to Zijin, a Chinese company.  I don’t know much about Zijin, other than having heard Norway’s government directed its $790 billion oil fund to sell holdings in some companies because of their environmental performance. Zijin was one of these companies.
In light of the Norway decision, some groups are questioning whether Zijin should be allowed to buy mining assets currently owned by Canadian or American companies.

Its a balancing act

It appears that some groups would like their governments to step in and prevent a company from selling their mining assets to another company that may have a poor reputation or limited financial capacity. The fear is the new company would operate in a non-sustainable manner and ignore local environmental rules.
Government sanctioning of deals gets tricky in that how do they define which companies have poor reputations and which don’t.  Also how can they dictate to the shareholders of a company, possibly nearing bankruptcy, that they cannot sell their assets to a certain interested party?
Governments have stepped in and blocked acquisitions in the past but these were mainly related to deals involving antitrust issues or technology of national interest.
It will be interesting to see whether the idea of governments sanctioning the acceptability of acquirers in the mining industry will gain traction.
It may be an overstep for the government of one country to block the acquisition of a foreign property when the owner may not have the capability to develop the project while the acquirer does.
The foreign government may want to see their own resources  developed but another government may be hindering that by blocking transfer of ownership.
The last thing we want are more country-to-country disputes. I presume the only option in this case is to revoke the mineral concessions and assign them to someone willing to develop them.  One company will lose an asset, which creates new issues related to compensation.  It also harms the reputation of that country as a place to invest in.  Unfortunately it had no choice if a foreign government was getting in the way.

Conclusion

The bottom line is whether the government of one country have the veto rights to prevent development in another country?  Does the government of one country have the right to decide the environmental standards in another via prevention of an asset sale?
This will be an interesting issue to continue to watch in the future.
Note: You can sign up for the KJK mailing list to get notified when new blogs are posted.
Share

Mine Approvals May Be Hinging on the Corporate Bank Account

EIA EIS EISA
A few months ago there were some discussions on a now defunct blog site  “I THINK MINING” and on a website (https://lindsaynewlandbowker.wordpress.com) regarding whether mine environmental approvals should be linked to the overall financial health of the parent company.
This point was raised in regards to the Mount Polley tailing dam incident as well as other notable tailings failures.   The logic behind the idea was that the potentially high cleanup cost for tailings failures could exceed the financial capacity of a small mining company and then the failure cleanup cost would need to be borne by the taxpayer.

Are reclamation bonds of sufficient size?

Closure bonds for final reclamation are standard practice in current permitting approvals and part of the normal course of business.  However what is being newly proposed is the requirement to have sufficient corporate funds in the bank account to pay remediation costs for some hypothetical failure.  This has not been part of the current environmental approval process as far as I know. Depending on the type of failure scenario one envisioned, the hypothetical cleanup cost could range from low to enormous.

A failure cleanup fund

One of the options being proposed is that the various mining companies in a jurisdiction each contribute money to a failure cleanup fund that could be used for mitigation purposes.
The ultimate goal of this idea may be better environmental practice or simply as a means to curtail mine development by handcuffing smaller companies.
Many deposits are too small for the major miners so the intermediate companies are the only ones interested in them.  However if they don’t have the financial reserves in the corporate bank account, then their projects would not get approved.

Small companies would only be explorers

It would impact on the ability for the smaller or intermediate miners to develop new mines if the corporate bank account of the parent company becomes a large part of the mine permitting process.  Not only would they need to finance the construction capital cost, which is not easy these days, but they would also need to finance a tailings failure cleanup fund.
It will be interesting to see if this suggested permitting approach gains any traction in the future because it could have a significant impact on the operating approach of the junior industry.  Perhaps everyone could really only be exploration companies.

Filtered tailings stack

One impact from this might be that new operators will be pushed towards dry stack tailings.  Possibly the added costs for dry stacking could be offset against the need for the tailings failure fund.
Regardless of how it would be done, this would become an added cost to the mining industry at a time when it doesn’t need more cost pressures.
Share

Mining Cashflow Sensitivity Analyses – Be Careful

cashflow sensitivity
One of the requirements of NI 43-101 for Item 22 Economic Analysis is “sensitivity or other analysis using variants in commodity price, grade, capital and operating costs, or other significant parameters, as appropriate, and discuss the impact of the results.”
The typical result of this 43-101 requirement is the graph seen below (“a spider graph”, which is easily generated from a cashflow model.  Simply change a few numbers in the Excel file and then you get the new economics.  The standard conclusions derived from this chart are that metal price has the greatest impact on project economics followed by the operating cost.   Those are probably accurate conclusions, but is the chart is not telling the true story.
DCF Sensitivity GraphI have created this same spider graph in multiple economic studies so I understand the limitations with it.   The main assumption is that all of the sensitivity economics are based on the exact same mineral reserve and production schedule.
That assumption may be applicable when applying a variable capital cost but is not applicable when applying varying metal prices and operating costs.
Does anyone really think that, in the example shown, the NPV is $120M with a 20% decrease in metal price or 20% increase in operating cost?   This project is still economic with a positive NPV.
In my view, a project could potentially be uneconomic with such a significant decrease in metal price but that is not reflected by the sensitivity analysis.  Reducing the metal price would result in a change to the cutoff grade.  This changes the waste-to-ore ratio within the same pit.  So assuming the same size mineral reserve is not correct in this scenario.
Changes in economic parameters would impact the original pit optimization used to define the pit upon which everything is based.
A smaller pit size results in a smaller ore tonnage, which may justify a smaller fleet and smaller processing plant, which would have higher operating costs and lower capital costs.
A smaller mineral reserve would produce a different production schedule and shorter mine life.  It can  get quite complex to examine it properly.
Hence the shortcut is to simply change inputs to the cashflow model and generate outputs that are questionable but meet the 43-101 requirements.
The sensitivity information is not just nice to have.   Every mining project has some flaws, which can be major or minor. Management understandably have a difficult task in making go/no-go decisions. Financial institutions have similar dilemmas when deciding on whether or not to finance a project.   You can read that blog post at this link “Flawed Mining Projects – No Such Thing as Perfection
So if the spider chart isnt he best way to tackle the risk issue, what way is better?  In another blog post I discuss an different approach using the probabilistic risk evaluation (Monte Carlo).  Its isn’t new but now well adopted yet by the mining industry.  You can learn more at “Mining Financial Modeling – Make it Better!
Note: If you would like to get notified when new blogs are posted, then sign up on the KJK mailing list on the website.   
Share

Open Pit Optimization – How I View It

Mining feasibility study
One of the first steps in an open pit design is the pit optimization analysis.  Pit optimization is used to define the most profitable pit shell for a given set of economic parameters.  The economic parameters include the metal prices, processing recoveries, and site operating costs. Normally when optimization is done, a range of metal prices or Revenue Factors (“RF”) is used to develop a series of nested shells to understand how the pit will expand or contract with increasing or decreasing metal prices.
Once the optimization step is complete, mining engineers will then design the pit inside that shell, introducing benches and ramps.  The pit design should mimic the selected optimized shell as closely as possible.
The pit design may (or may not) closely replicate the optimization shell depending on the slope angles used in the optimization and where the haul ramps are located in the design.
Hence the actual ore and waste tonnages mined may be different that the tonnages defined by the optimizer.
Various experts in pit optimization will use approaches of differing complexity.  Some may apply variable mining costs with pit depth; apply variable process recoveries linked to head grade; apply variable pit slopes by sector or depth, apply dilution and ore losses; etc.   One can make the pit optimization step as simple or detailed as one wants it.
The question is whether detailed pit optimization is warranted.  My view is that overly detailed pit optimization is  not required, other than if one wants to test parameter sensitivity on the resulting pit size and shape.  There are just too many uncertainties in the parameters being used in optimization.

Open Pit Optimization Uncertainties

Some of the uncertainties involved in the optimization approach are listed below:
  • Pit optimization can generate large pits that would have a long mine life.  However one doesn’t really know the metal prices far into the future.   So will that final pit ever get mined, or might it even be larger than shown.
  • Pit optimization is typically done at the start of a study, so one doesn’t have the detailed operating costs yet. The size of the project may be unknown and one has to use rough estimates for future costs and possibly even assume preliminary process recoveries.
  • Operating costs will also change in the future, and the optimization step is just a snapshot using current information.
  • Sometimes the optimization includes the use of Inferred resources, which are uncertainty.   Sometimes optimization is done only using Measured and Indicated resource, yet there may be areas if Inferred resource that ultimately convert to M &I and these will have been ignored.  So, either way you do it, you are not sure what ore the pit can captured and will  to shape the pit.
  • The smaller pits, if developed, would consist of smaller operations and may have different operating costs than assumed in the optimization.   Similarly larger pits may have different throughput rates and  operating costs than assumed in the optimization.
  • The ore and waste split reported within the pit will be based on a specific life-of-mine cutoff grade.  This is based on the fixed metal price and operating cost assumptions applied.
  • Overall pit wall slopes may differ for shallow pits versus deep pits.  Slopes may vary above the groundwater table and below it.  In many instances during pit optimization the wall angles are maintained at the same angle irrespective of the pit depths.   Sometimes geotechnical programs have not yet been completed, so optimization slope angles are simply educated guesses.
  • Dilution may be applied globally during pit optimization (unless one is working with a diluted block model).  In reality, dilution may differ in different parts of the ore body, and that may not be considered in the optimization stage. For more discussion on dilution in general, read the blog “Ore Dilution Prediction – Its Always an Issue“.

Conclusion

The bottom line is that pit optimization should be viewed as a guide to the pit design, but not as a highly precise calculation.  There are too many uncertainties in the parameters used.
There is always opportunity for future miner operators to examine pushback to grow the pit larger than initially envisioned.  Having said all that, one should still understand how future changes in metal prices can impact on the pit size, and then assess whether practical pushbacks are possible.   Thin sliver pushbacks are operationally difficult so this should be understood at the start.
While open pit optimization is not a precise science, there is still merit in examining how the pit size and shape reacts to changes in different parameters.  There are many ways to examine this and help select which shell should be advanced into the design stage. It can be more than just looking at the NPV versus Revenue Factor chart.   You can read this post at this link “Pit Optimization – More Than Just a “NPV vs RF” .
Note: If you would like to get notified when new blogs are posted, then sign up on the KJK mailing list on the website.   Follow us on Twitter at @KJKLtd for updates and insights.
Share

Mining Project Economics – Simple 1D Model

mining desktop study
In a previous article I outlined my thoughts on the usefulness of early stage financial modelling (“Early Stage “What-if” Mine Economic Analysis – Its Valuable”).     My observation was that it is useful to take a few days to build a simple cashflow model to help your team better understand your project.

By “simple” I mean really simple.

This blog describes one of the techniques that I use to take a super-quick look at any project; whether it is for a client wishing to understand his project at a high level; or whether it is a project that I have read about.  There isn’t any actual study or production schedule available yet.  Maybe there is only a mineral resource estimate available.
It takes about 10 minutes to plug the numbers into my template to get fast results.  The image below is an example of the simple model that I use, but anyone can build one for themselves.

Screenshot of Simple Economic Model

I use the term one dimensional (“1D”) model since it doesn’t use the typical X-Y matrix with years across the top and production data down the page.
The 1D model simply relies simple on life of mine (“LOM”) totals to estimate the total revenue, total operating cost, and total profit.  This determines how much capital expenditure the project can tolerate.
The only caveat is that you need to have some sense for operating and capital costs for similar projects. This analysis can be on both a pre-tax and simple after-tax basis.
Using estimated metal prices and recoveries, the first step is to calculate the incremental revenue generated by each tonne of ore (see a previous article “Ore Value Calculator – What’s My Ore Worth?”).
Next that revenue per tonne is multiplied by the total ore tonnage to arrive at the total revenue over the life of mine.
The second step is to determine the life of mine operating cost, and again this simple calculation is based on estimated unit operating costs multiplied by the total tonnages being handled.
The third step is to calculate the life of mine profit based on total revenue minus total operating cost.
The potential net cashflow would be calculated by deducting an assumed capital cost from the life-of-mine profit.  The average annual cashflow is estimated based on the net cashflow divided by the mine life.  An approximate NPV can be calculated by determining the Present Value of a series of annual payments at a certain discount rate.
The reasonableness of the 1D model will be examined via benchmarking and this will be summarized once completed.  I will include a link to that future blog here.

You need to understand your project

One can easily evaluate the potential impact of changing metal prices, changing recoveries, ore tonnages, operating costs, etc. to see what the economic or operational drivers are for this project.  This can help you understand what you might need in order to make the project viable.

Conclusion

The bottom line is that a 1D economic calculation is very simplistic but still provides a vision for the project.  The next step in the economic modelling process would be a 2D model based on an annual production schedule.  The 1D approach is just a quick first step in looking at the potential.  You can do it even when you only know the head grades and some generalized orebody information.
The two ways you can apply the simple 1-D model are:
  1. evaluate the potential of early stage projects using cost inputs from other studies,
  2. examine a project’s sensitives (units costs, recoveries, prices) by calibrating your simple model to the published study (i.e. use the same parameters and make changes as needed.
The entire blog post library can be found at this LINK with topics ranging from geotechnical, financial modelling, and junior mining investing.


Note: If you would like to get notified when new blogs are posted, then sign up on the KJK mailing list on the website.  
Share

Financings – It Helps to Have a Credible Path Forward

mine economics
Update: This blog was initially written in May 2015, however not much as changed to the end of 2018.
Let me say the obvious; the state of the junior mining market is not great these days.  The number of financings is down and it seems there are a lot of companies struggling to get their piece of the financing pie.   People mention to me that there actually is a fair bit of private equity funding available but only for the right projects.
I have heard from geologist colleagues that financing grass-roots exploration is still extremely difficult.  That is unless company management has had past successes or is well connected to the money scene.
I’m told that 43-101 resource estimates alone no longer generate much excitement.  For projects to be “on the radar” they need to be advanced to at least the PEA stage.  It seems that investors want some vision of what the project might eventually look like.
I have be made aware of more junior mining companies that are struggling for cash while others seemed to have no problem in getting at least some funding to continue their operations.  To me, the biggest differences between these two situations are;
  • If there is top notch management in place,
  • The type of project they had,
  • If their path forward and development plan made sense.

You don’t want to always change management

Management is what it is.  Companies attempt to bring on experienced people to the executive level or to the Board level.   Experienced management can hopefully establish if their project will have a high probability of success or if the project is going to be a hard sell.  This will provide guidance on whether to continue spending money on the project or look for a new project.
From my experience in undertaking due diligence, when a company is looking for financing it is important that  management have the capability to present an orderly, practical, and realistic path forward.  It is important to demonstrate where they will spend the money.
I have participated in due diligence meetings listening to management teams explain that they will have a resource estimate this year and be in production in two years.  Those around the table glance at one another, knowing that they will be lucky to have a feasibility study completed by that time and even more lucky to have their environmental permits in place.   This makes investors nervous.

Keep plans realistic and achievable

It does not help the perception of a management team (or the project itself) if the path forward is unrealistic and unattainable.  The exception being if the management team have done it before.   Similarly low-balling cost estimates and presenting great NPV’s will usually fool no one that has experience. It ultimately may do more harm to credibility than good.
The bottom line is that in order for a project (and the management team) to get serious attention from potential investors is to make sure there is a realistic view of the project itself and have a realistic path forward.
Even a good property can be tarnished by making the technical aspects look over-promotional rather than real.  Make sure the right technical people are involved in the entire process and that company management are listening to them.
Note: If you would like to get notified when new blogs are posted, then sign up on the KJK mailing list on the website.  Otherwise I post notices on LinkedIn, so follow me at: https://www.linkedin.com/in/kenkuchling/.
Share

Ore Value Calculator – What’s My Ore Worth?

rock economic value
In my view, one of the most important things you need to understand about your orebody is the insitu rock value. Hopefully it is economic, i.e. an ore value.  Its the key driver in shaping the economics of any mining project.
The two main nature-driven factors in the economics of a mining project are the ore grade and the ore tonnage.  In simplistic terms, the ore grade will determine how much incremental profit can be generated by each tonne of rock processed.
The ore tonnage will determine whether the cumulative profit generated all the ore will be sufficient to pay back the project’s capital investment plus provide some reasonable profit to the owner.

Does the Ore Grade Generate a Profit ?

In order to understand the incremental profit generated by each ore tonne one must first convert the ore grade into a revenue dollar value.   This calculation will obviously depend on metal prices and the amount of metal recovered.  For some deposits with multiple metals, the total revenue per tonne will be based on the summation of value contributed by each metal. Some metals may have different process recoveries and different net smelter payable factors, so several factors come into play.
To help calculate the value of the insitu ore, I have created a simple cloud-based spreadsheet at this link (Rock Value Calculator).  An example screenshot is shown below.  Simply enter your own data in the yellow shaded cells and the rock values are calculated on a “$ per tonne” basis. since the table is pre-populated, one must zero out the values for metals of no interest.


Rock Value Calculator Pic

Price: represents the metal prices, in US dollars for the metals of interest.
Ore Grade: represents that head grades for the metals of interest in the units as shown (g/t and %).
Process Recovery: represents the average % recovery for each of the metals of interest.
Payable Factor: represents the net payable percentage after various treatment, smelting, refining, penalty charges.  This is simply an estimate depending on the specific products produced at site.  For example, concentrates would have an overall lower payable factor than say gold-silver dore production.
Insitu Rock Value: this output is the dollar value of the insitu rock (in US dollars), without any process recovery or payable factors being applied.
NSR Rock Value: this output represents the net smelter return dollar value after applying the recovery and payable factors.  This represents the actual revenue that could be generated and used to pay back operating costs.  One can see the impact that these payables have on the overall value.

Mining Profit = Revenue – Cost

The final profit margin will be determined by subtracting the mine operating cost from the NSR Rock Value.  These operating costs would include mining, processing, G&A, and some offsite costs.  Typically large capacity open pit operations may have total operating costs in the range of $10-15/tonne, while conventional hardrock underground operations would be much higher ($50->$100/t).

Conclusion

The bottom line is that very early on one should understand the net revenue that your project’s head grades may deliver.   How valuable is the rock?   It is a fairly simple calculation to undertake.
You can even start evaluating the rock at the exploration drilling stage.  I have a cloud-based calculator for this at the link “Drill Intercept Analysis“.  This calculator is a bit more complex than the Rock Value Calculation but relies on inputting drill intercept data.
Ore value will give sense for whether its a high margin project or whether the ore grades are marginal and higher metal prices or low operating costs will be required. The earlier one understands the potential economics of the different ore types, the better one will be able to visualize, design, and advance the project.
For gold deposits, I have another blog post that discusses grades, values, and how they related to open pit or underground mining costs.  Low grade narrow intervals like have much less economic potential than wide low grade interval or narrow high grade gold intervals. You can read that post at this link “Gold Exploration Intercepts – Interesting or Not?


Note: If you would like to get notified when new blogs are posted, then sign up on the KJK mailing list on the website.  Otherwise I post notices on LinkedIn, so follow me at: https://www.linkedin.com/in/kenkuchling/.


Share