

Typically gold mines consist of either a heap leach (HL) operation or a CIL type plant. There are a few projects that operate (or are considering) concurrent heap leach and CIL operations. Ultimately the mineral resource distribution determines if it makes economic sense to have both. This blog discusses this concept based on past experience.
A CIL operation has higher capital and operating costs than a heap leach. However that higher cost is offset by achieving improved gold recovery, perhaps 20-30% higher. At higher gold prices or head grades, the economic benefit from improved CIL recovery can exceed the additional cost incurred to achieve that recovery.
Some background
Several years ago I was VP Engineering for a Vancouver based junior miner (Oromin Expl) who had a gold project in Senegal. We were in the doldrums of Stage 3 of the Lassonde Curve (read this blog to learn what I mean) having completed our advanced studies. Our timeline was as follows.
Initially in August 2009 we completed a Pre-Feasibility Study for a standalone CIL operation. Subsequently in June 2010 we completed a Feasibility Study. The technical aspects of Stage 2 were done and we were entering Stage 3. Now what do we do? Build or wait for a sale?
The property’s next door neighbor was the Teranga Sabodala operation. It made sense for Teranga to acquire our project to increase their long term reserves. It also made sense for a third party to acquire both of us. The Feasibility Study also made the economic case to go it alone and build a mine.
 While waiting for various third-party due diligences to be completed, the company continue to do exploration drilling. There were still a lot of untested showings on the property and geologists need to stay busy.
Two years later in 2013 we completed an update to the CIL Feasibility Study based on an updated resource model. Concurrently our geologists had identified seven lower grade deposits that were not considered in the Feasibility Study.
These deposits had gold grades in the range of 0.5 to 0.7 g/t compared to 2.0 g/t for the deposits in the CIL Feasibility Study. We therefore decided to also complete a Heap Leach PEA in 2013, looking solely on the lower grade deposits.
These HL deposits were 2-8 km from the proposed CIL plant so their ore could be shipped to the CIL plant if it made economic sense. Test work had indicated that heap leach recoveries could be in the range of 70% versus >90% with a CIL circuit. The gold price at that time was about $ 1,100/oz.
Ultimately our project was acquired by Teranga in the middle of 2013.
Where should the ore go?
 With regards to the Heap Leach PEA, we did not wish to complicate the Feasibility Study by adding a new feed supply to that plant from mixed CIL/HL pits. The heap leach project was therefore considered as a separate satellite operation.
The assumption was that all of the low grade pit ore would go only to the heap leach facility. However, in the back of our minds we knew that perhaps higher grade portions of those deposits might warrant trucking to the CIL plant.
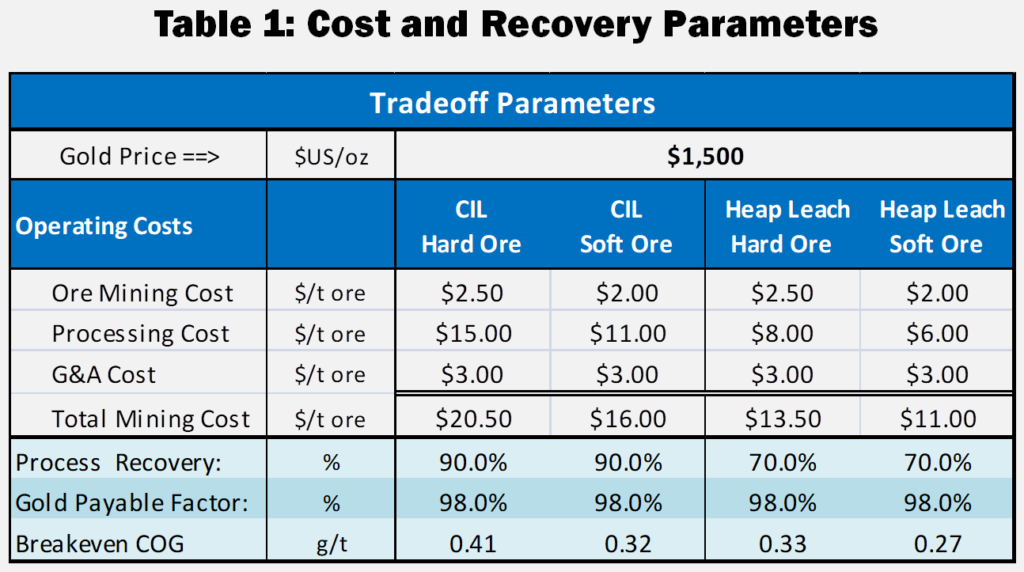
For internal purposes, we started to look at some destination trade-off analyses. We considered both hard (fresh rock) and soft ore (saprolite) separately. CIL operating costs associated with soft ore would be lower than for hard ore. Blasting wasn’t required and less grinding energy is needed. The CIL plant throughput rate could be 30-50% higher with soft ore than with hard ore, depending on the blend.
 I have updated and simplified the trade-off analysis for this blog. Table 1 provides the costs and recoveries used herein, including increasing the gold price to $1500/oz.
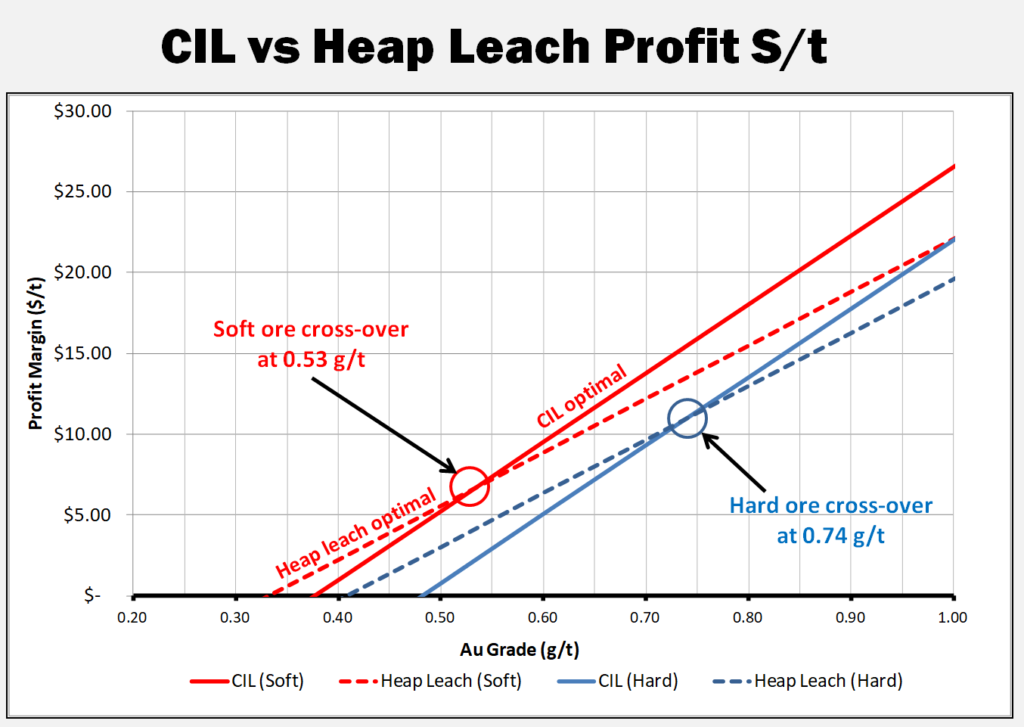
The graph shows the profit per tonne for CIL versus HL processing methods for different head grades.
The cross-over point is the head grade where profit is better for CIL than Heap Leach. For soft ore, this cross-over point is 0.53 g/t. For hard ore, this cross over point is at 0.74 g/t.
The cross-over point will be contingent on the gold price used, so a series of sensitivity analyses were run.
The typical result, for hard ore, is shown in Table 2. As the gold price increases, the HL to CIL cross-over grade decreases.
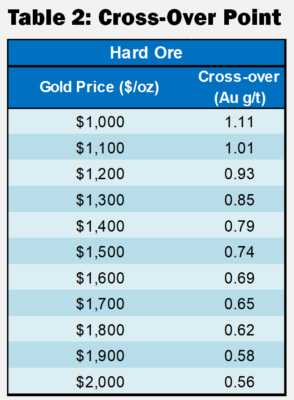 These cross-over points described in Table 2 are relevant only for the costs shown in Table 1 and will be different for each project.
Conclusion


 Normally I don’t write about mining stock markets, preferring instead to focus on technical matters. However I have seen some recent discussions on Twitter about stock price trends. For every stock there are a wide range of price expectations. Ultimately some of the expectations and realizations can be linked back to the Lassonde Curve.

 Stage 5 is the start-up and commercial production period, possibly nerve-racking for some investors. This is where the rubber hits the road. The stock price can fall if milled grades, operating costs, or production rates are not as expected.
 Some corporate presentations will highlight the Lassonde Curve, particularly when they are rising in Stage 1. You are less likely to see the curve presented when they are rolling along in Stages 2 or 3.
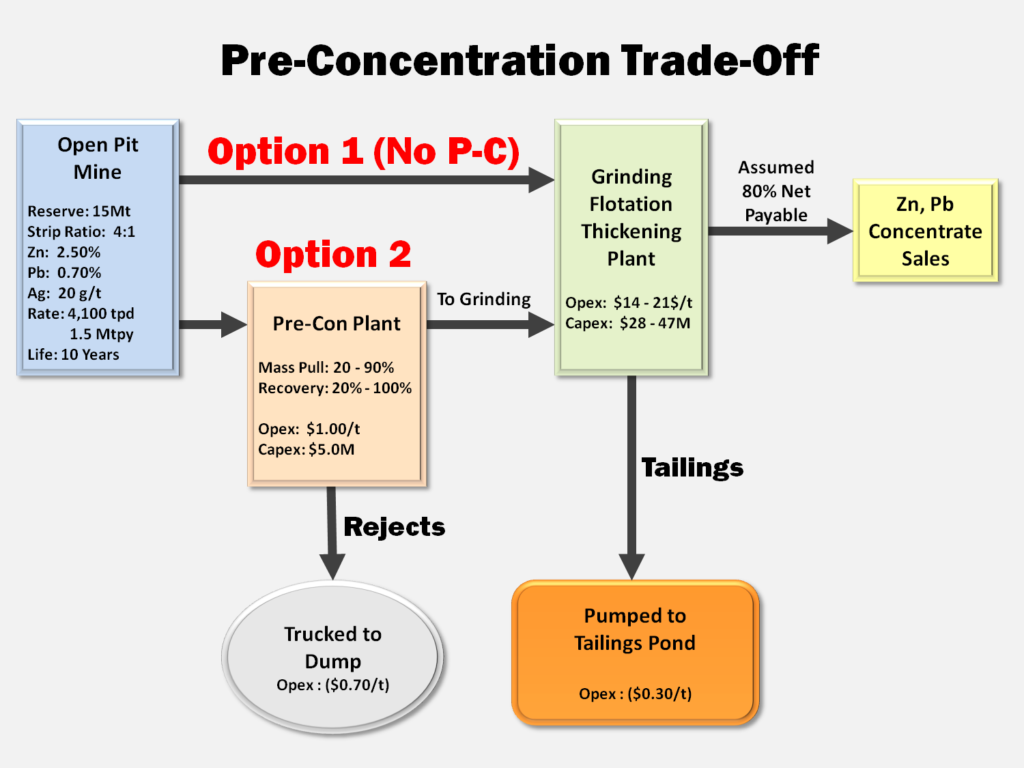
 Concentrate handling systems may not differ much between model options since roughly the same amount of final concentrate is (hopefully) generated.
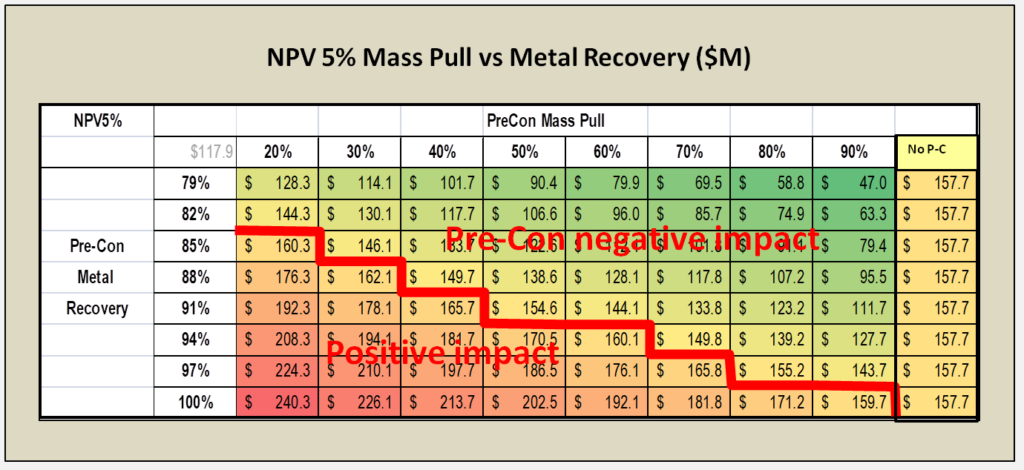
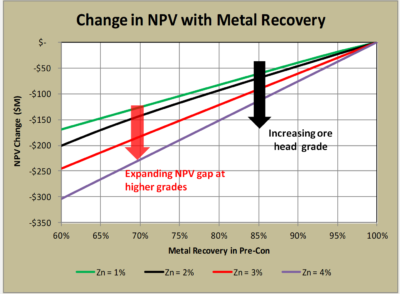 4. The head grade of the deposit also determines how economically risky pre-concentration might be. In higher grade ore bodies, the negative impact of any metal loss in pre-concentration may be offset by accepting higher cost for grinding (see chart on the right).
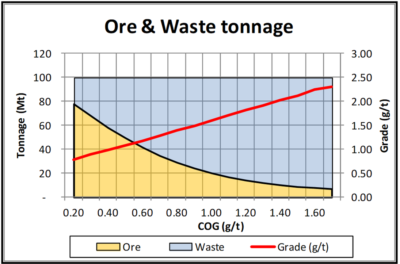 I had a grade tonnage curve, including the tonnes of ore and waste, for a designed pit. This data is shown graphically on the right. Essentially the mineable reserve is 62 Mt @ 0.94 g/t Pd with a strip ratio of 0.6 at a breakeven cutoff grade of 0.35 g/t. It’s a large tonnage, low strip ratio, and low grade deposit. The total pit tonnage is 100 Mt of combined ore and waste.

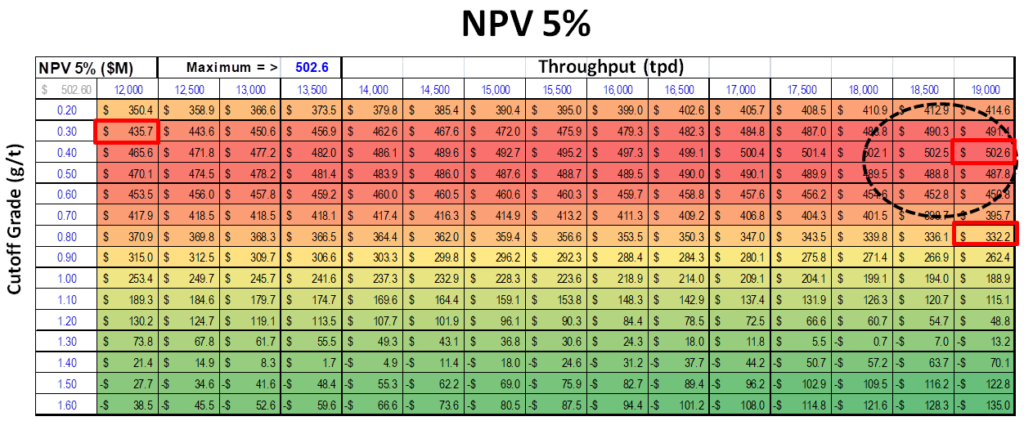

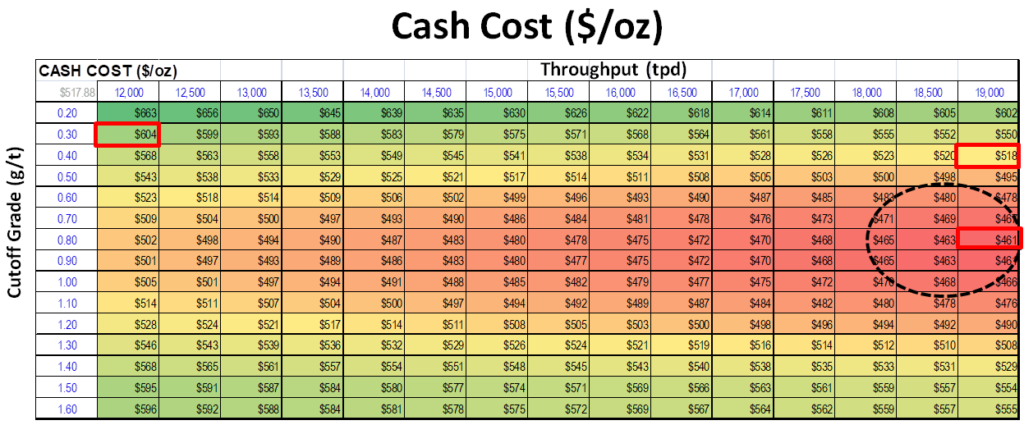
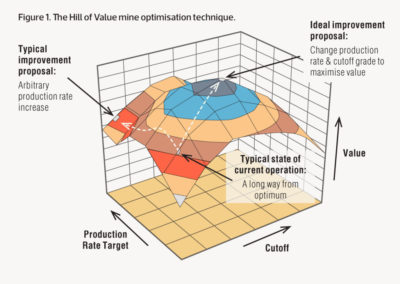
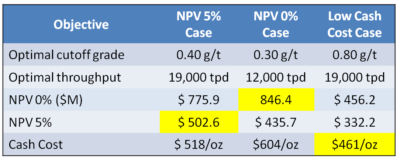 The Hill of Value is an interesting optimization concept to apply to a project. In the example I have provided, the optimal project varies depending on what the financial objective is. I don’t know if this would be the case with all projects, however I suspect so.

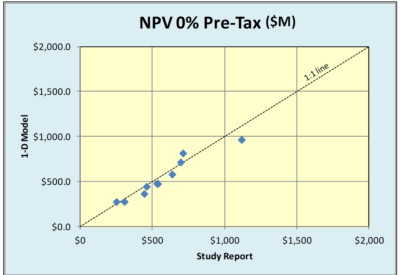 One of the questions I have been asked is how valid is the 1D approach compared to the standard 2D cashflow model. In order to examine that, I have randomly selected several recent 43-101 studies and plugged their reserve and cost parameters into the 1D model.
 There is surprisingly good agreement on both the discounted and undiscounted cases. Even the before and after tax cases look reasonably close.
 Perhaps with technology, like Zoom, one can replicate the personal feel of a trade show booth. One can still have back and forth conversations with investors rather than just doing lecture style webinars.
 Management teams should introduce more than just the CEO or COO. Include VP’s of geology, engineering, corporate development, from time to time. Don’t hesitate to let the public meet more of your team. Trade show booths are often manned by different team members.
 Better communication with investors can increase confidence in a management team. Although some investors may not enjoy technical discussions, I think there is a subset that will find them very helpful and interesting. There will likely be an audience out there.
 As an aside, if you are using Zoom make sure the host has configured the right settings. There are instances where anonymous participants can suddenly share their own computer screen, i.e. with questionable videos, to the group. It’s been referred to as “zoom bombing”.
 The number of independent mining consultants is increasing daily as more people reach retirement age or are made redundant.
 GLG (
GLG ( Digbee (
 We often see junior mining companies benchmarking themselves against others. Sometimes corporate presentations provide graphs of enterprise value per gold ounce to demonstrate that a company might be undervalued.
 Lenders may have observers at site monitoring both construction progress and cash expenditures. Shareholders and analysts are watching for news releases that update the capital spending. Their concern is well founded due to several significant cost over-run instances.
 It would be a good thing if the mining industry (or other concerned parties) work together to create open source project databases. These would incorporate summary information and cost information for global mining projects. The information is already out there, it just needs to be compiled.
 Benchmarking can be a great tool when done correctly. Benchmarking capital costs might bring more transparency to the project development process. It may help convince nervous investors that the proposed costs are reasonable.
 Reading it further, it was apparent that their study consultant, Ausenco, was being paid in company stock in lieu of cash. The arrangement included an initial financing of $750k with a further $375k to follow once the pre-feasibility study was 75% complete. Upon completion of the study another share payment was due.
 I have never been in a situation where I was consulting with company shares as my compensation. Neither have I ever managed a study where outside consultants were being paid in shares. However I can see the possibility of interesting dynamics at play.
 Regarding the first item “impartiality”, in the past there have been questions raised about the impartiality of engineering firms. I first recall reading this claim many years ago in a public response to a mining EIA application. Unfortunately I cannot find the exact source now.
 It would be interesting to know how many consulting firms would be willing to accept compensation solely in shares. Stock prices move up and down and the outcome of the study itself can have an impact on share performance.
 There are several scenarios where NPV analysis decision making may conflict with the objectives of sustainable mining. Here are a few examples.
 4. Low grade ore stockpiling can help to increase early revenue and profit, thereby improving the project NPV and payback. Stockpiling of low grade and prioritization of high grade means that lower grade ore will be processed in the later stages of the project life. Who hasn’t been happy to develop a mine schedule with the grade profile shown on the right?
 7. Accelerated depreciation, tax and royalty holidays are types of economic factors that will improve NPV and early payback. They are one tool governments use to promote economic activity. These tax holidays will greatly enhance the NPV when combined with high grading and waste stripping deferral.
 NPV is one of the standard metrics used to make project decisions. The deferral of upfront costs in lieu of future costs is favorable for cashflow and investor returns. Similarly, increasing early revenue at the expense of future revenue does the same. Both approaches will help satisfy the financing concerns. However they may not be advantageous for creating long term sustainable projects.